What is Fibonacci Retracement? The Golden Ratio with practical use cases
What do pine cones, Da Vinci, and price charts have in common? Surprisingly, they are all linked by a simple mathematical sequence known as Fibonacci — and in the world of trading, it might just help explain why prices often turn where they do.
From Fibonacci retracement levels to extensions to how these patterns appear on real charts, this guide will go through what Fibonacci means for CFD traders and where it can be useful — without getting lost in the maths. Please note that this article is for informational and educational purposes only and should not be considered investment advice. Always do your own research before making investment decisions.
From Fibonacci retracement levels to extensions to how these patterns appear on real charts, this guide will go through what Fibonacci means for CFD traders and where it can be useful — without getting lost in the maths. Please note that this article is for informational and educational purposes only and should not be considered investment advice. Always do your own research before making investment decisions.
QUOTE
The most important rule of trading is to play great defense, not great offense.
— Paul Tudor Jones (American manager and philanthropist)
— Paul Tudor Jones (American manager and philanthropist)
Big ideas
- The Fibonacci retracement tool is based on a sequence of numbers dating back to the 12th century, but it is widely used in modern trading platforms to highlight potential turning points in price charts.
- The most commonly used Fibonacci levels (38.2%, 50%, and 61.8%) are not just random percentages. They are derived from ratios found in nature, architecture, and art.
- In CFD trading, Fibonacci tools can be applied across multiple timeframes, allowing traders to spot overlapping levels that may carry more significance.
What are Fibonacci (Fib) retracements?
DEFINITION
Fibonacci retracements are a popular charting tool used by many traders to help identify possible levels where price may pause, pull back, or reverse. The method is based on a sequence of numbers made famous by the Italian mathematician Leonardo of Pisa (also known as Fibonacci).
The tool itself takes a recent price move, either upward or downward, and plots horizontal lines at key percentage levels. These levels are based on ratios found within the Fibonacci sequence, including 23.6%, 38.2%, 50%, 61.8%, and 78.6%. On a chart, these percentages represent potential retracement levels, which traders often watch to see if price reacts at those points.
Fibonacci retracement levels are commonly applied to indices, forex pairs, commodities, and individual stocks in both short- and long-term timeframes. In CFD trading, Fibonacci retracement is often one of the first tools added to a chart during technical analysis, especially when trying to time an entry after a pullback in a trending market.
Fibonacci retracement levels are commonly applied to indices, forex pairs, commodities, and individual stocks in both short- and long-term timeframes. In CFD trading, Fibonacci retracement is often one of the first tools added to a chart during technical analysis, especially when trying to time an entry after a pullback in a trending market.
How does Fib retracement work in CFD trading?
In CFD trading, Fibonacci retracement works by taking two significant price points, typically the high point and low point of a significant directional move in the market — and using the Fibonacci retracement tool in your trading platform to draw a series of horizontal lines across the chart.
You can see the Fibonacci retracement tool applied on a fictional chart here where the two price points are labelled Top and Bottom.
You can see the Fibonacci retracement tool applied on a fictional chart here where the two price points are labelled Top and Bottom.
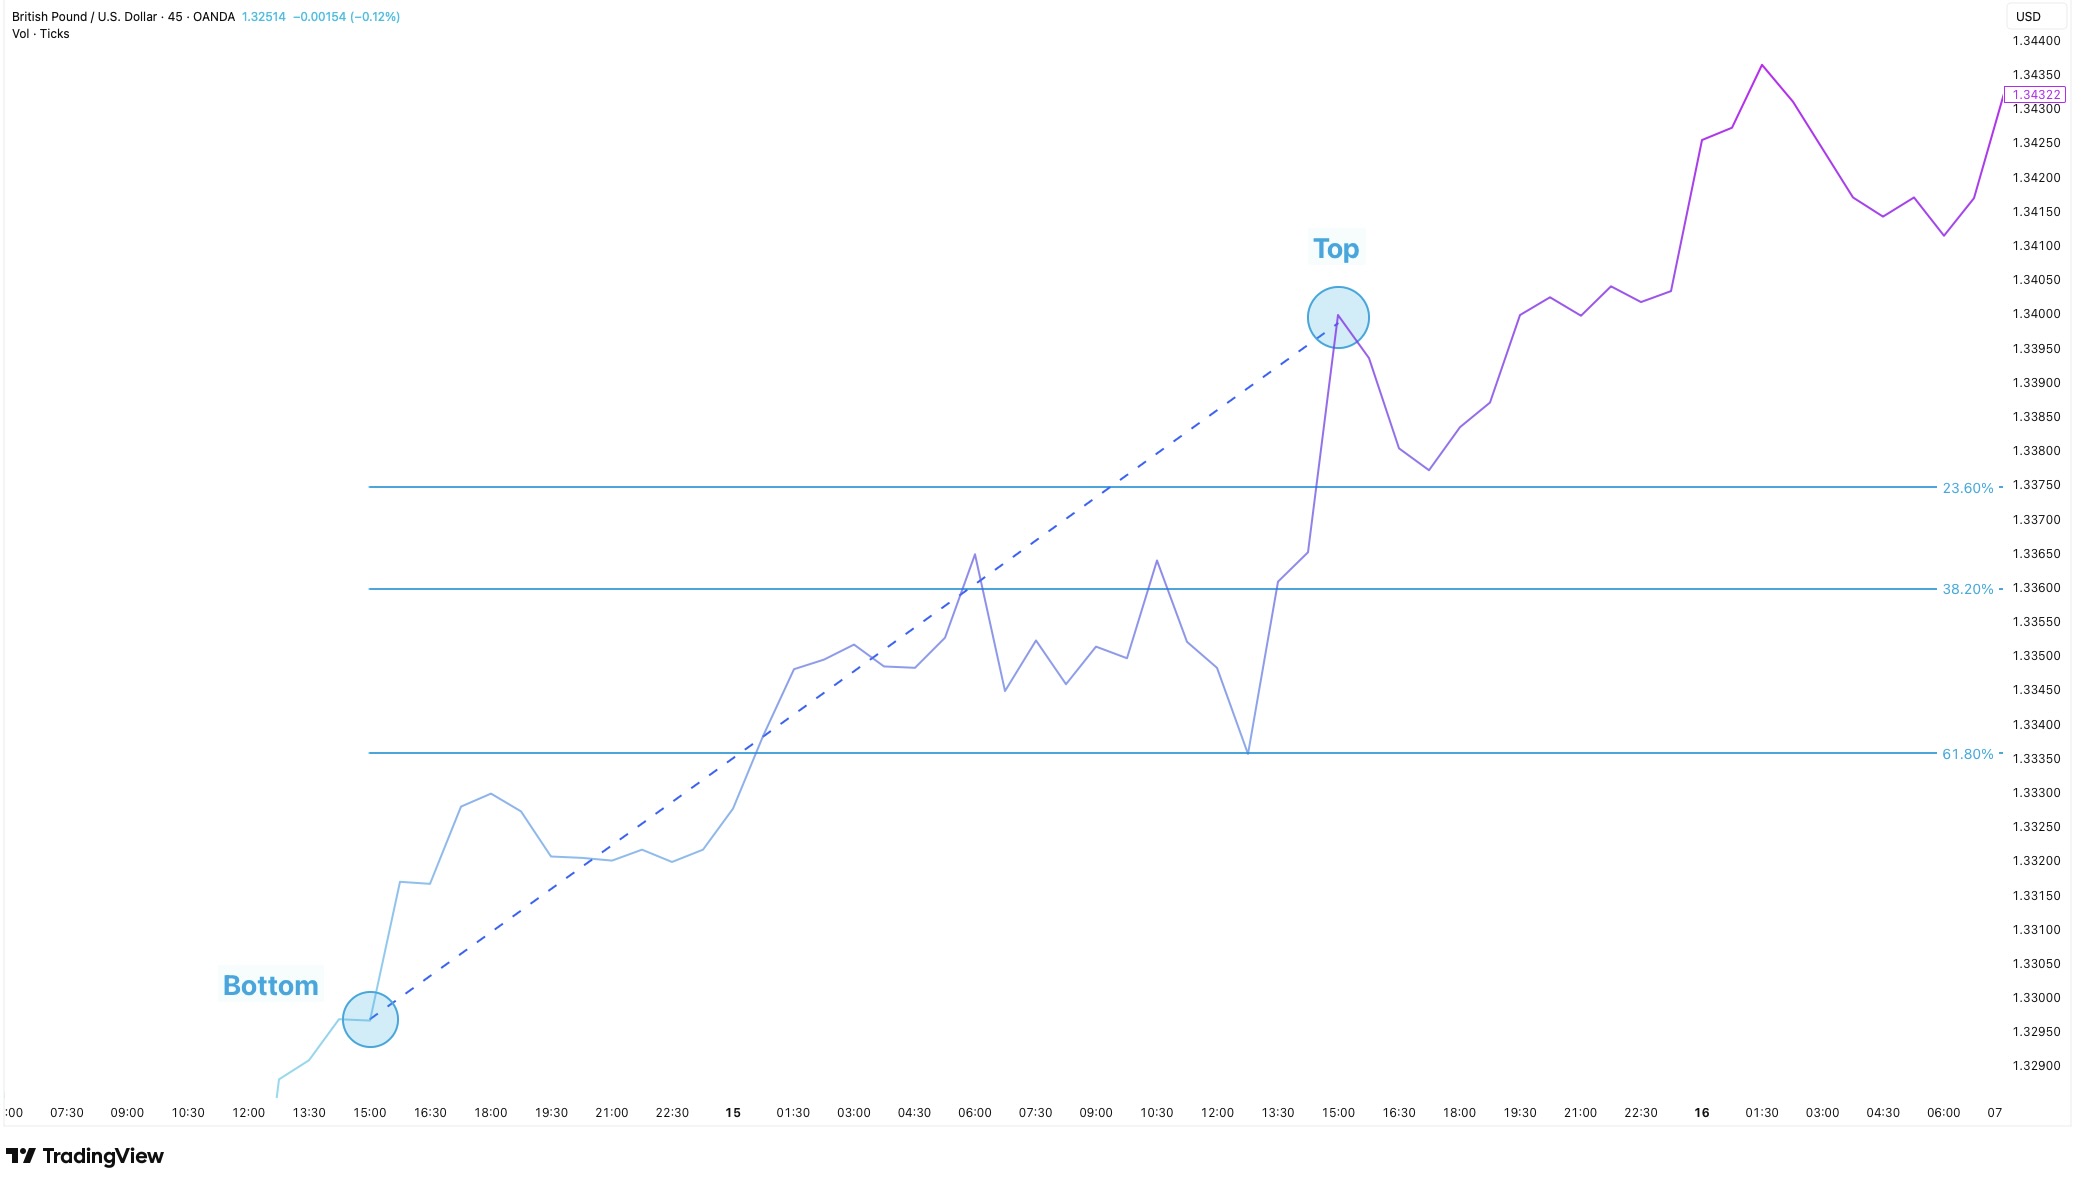 Source: TradingView. This example is for illustration purposes only and does not constitute financial advice. Past performance is not indicative of future results.
These lines correspond to the specific Fibonacci ratios mentioned above, marking potential areas where the price might pause, bounce, or otherwise continue its move.
The idea is not that these levels cause the price to move, but that many traders are watching the same zones as areas of value to place a trade. As a result, they often become self-reinforcing.
It is common to see Fibonacci levels like 38.2% or 61.8% line up with previous support or resistance zones. This confluence of both the Fib level and S&R level in the same place can increase confidence in a level’s relevance.
Note: Price doesn’t have to respect any level, whether it is backed up by Fibonacci, support or any other tool but the idea is that you have slightly increased your odds of identifying a potential turning point when these factors are in place. In a fast-moving market, Fib levels may break through without hesitation. In a slower market there could be a small reaction before the trend continues without a major turn.
For CFD traders, the Fibonacci tool helps add context to price movements, particularly in trending or corrective phases, that might not be so clear using price action alone.
Examples of the Fibonacci pattern
Fibonacci retracement patterns are most appropriately used when the market starts to pull back after a strong move in price — either upward or downward. The Fibonacci percentages are a certain percent of the initial move from which traders could decide to buy the dip.
The following examples demonstrate Fibonacci working in a shallow pullback as well as a deep pullback.
The following examples demonstrate Fibonacci working in a shallow pullback as well as a deep pullback.
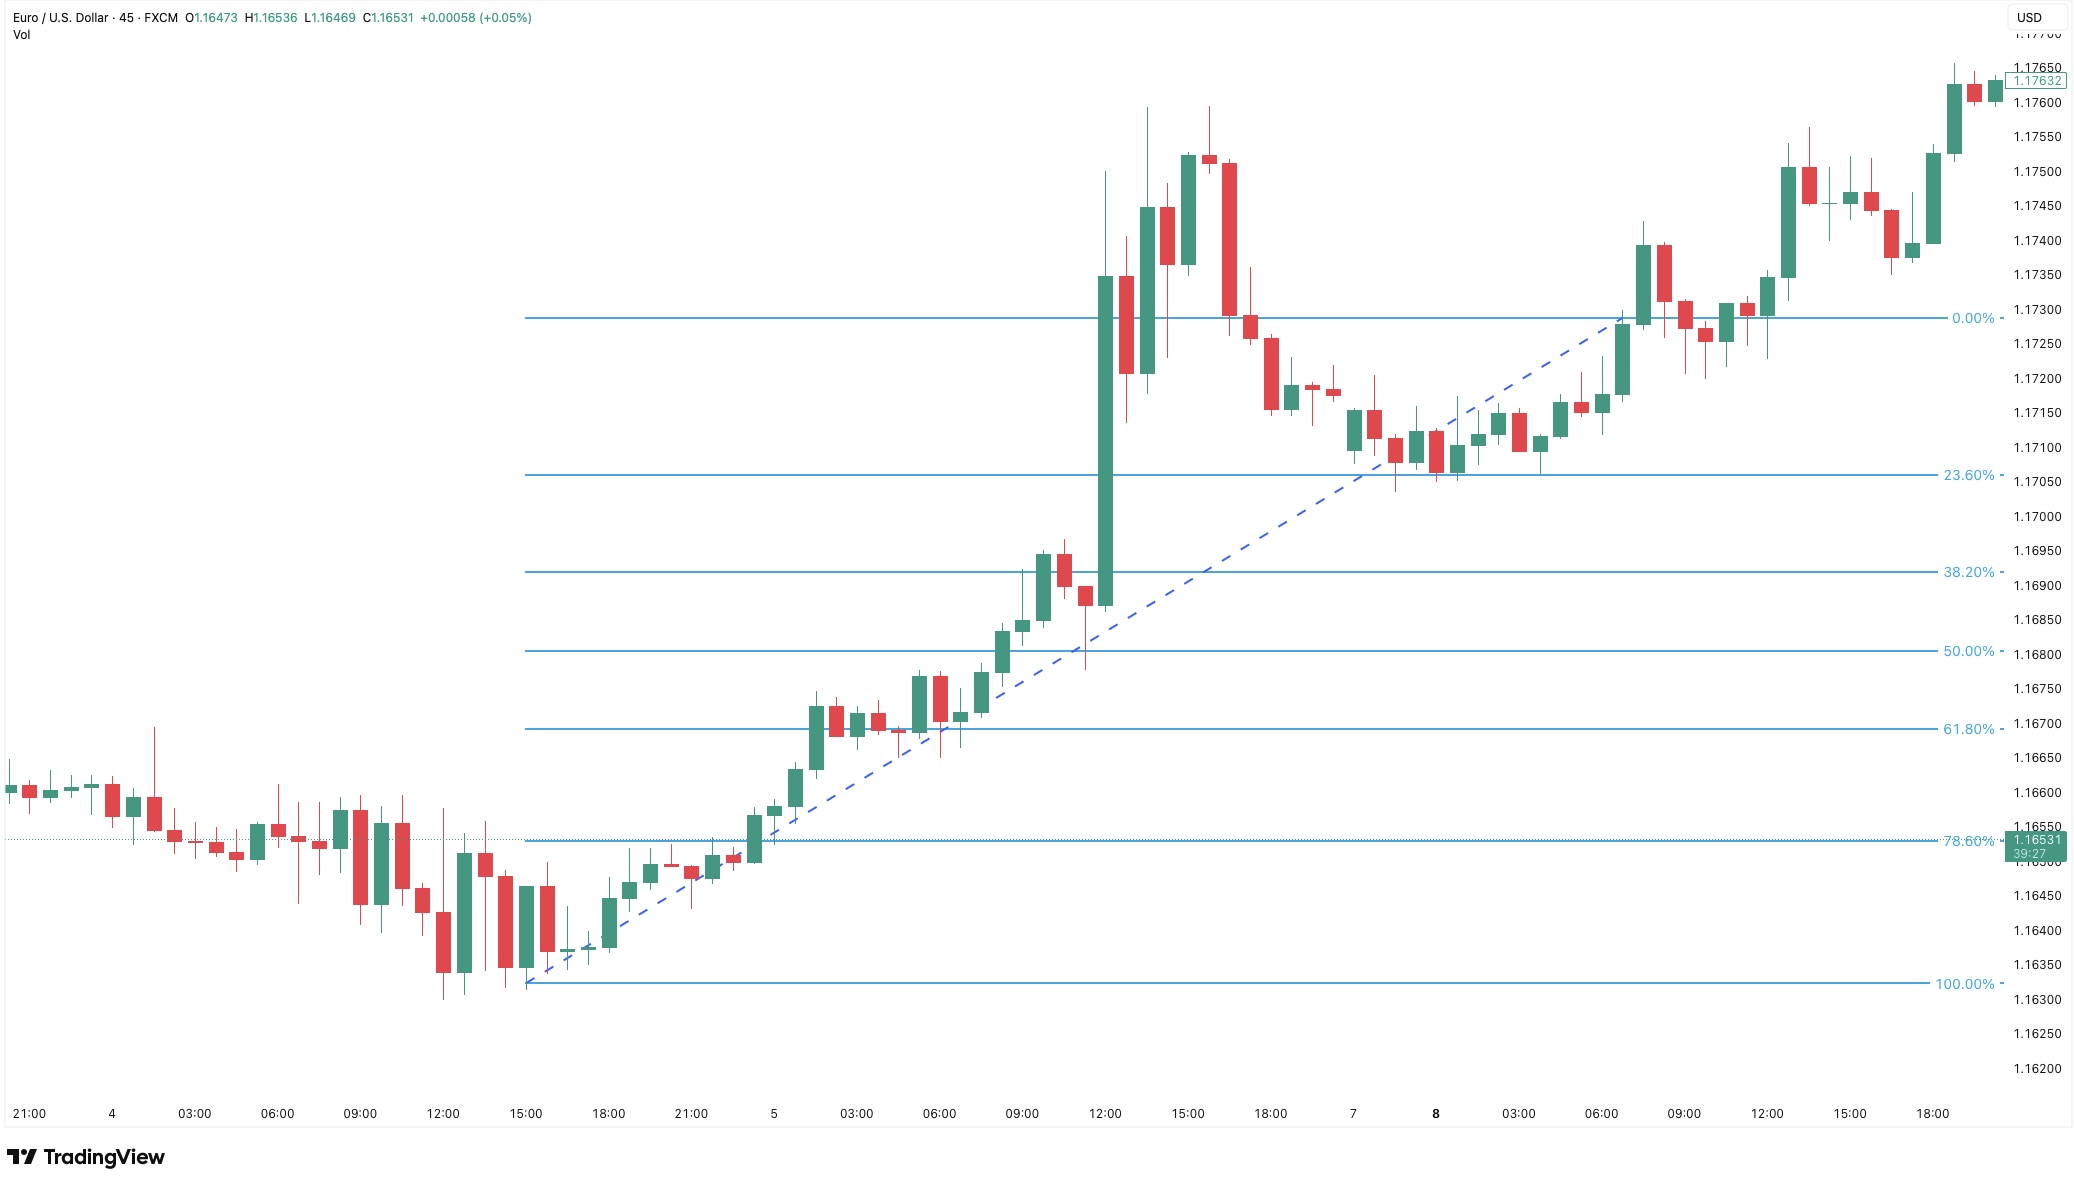
23.6% Fib Level example
Here the price posts a series of lows around the 23.6% Fibonacci level before continuing the uptrend and making a new high.
 Source: TradingView. This example is for illustration purposes only and does not constitute financial advice. Past performance is not indicative of future results.
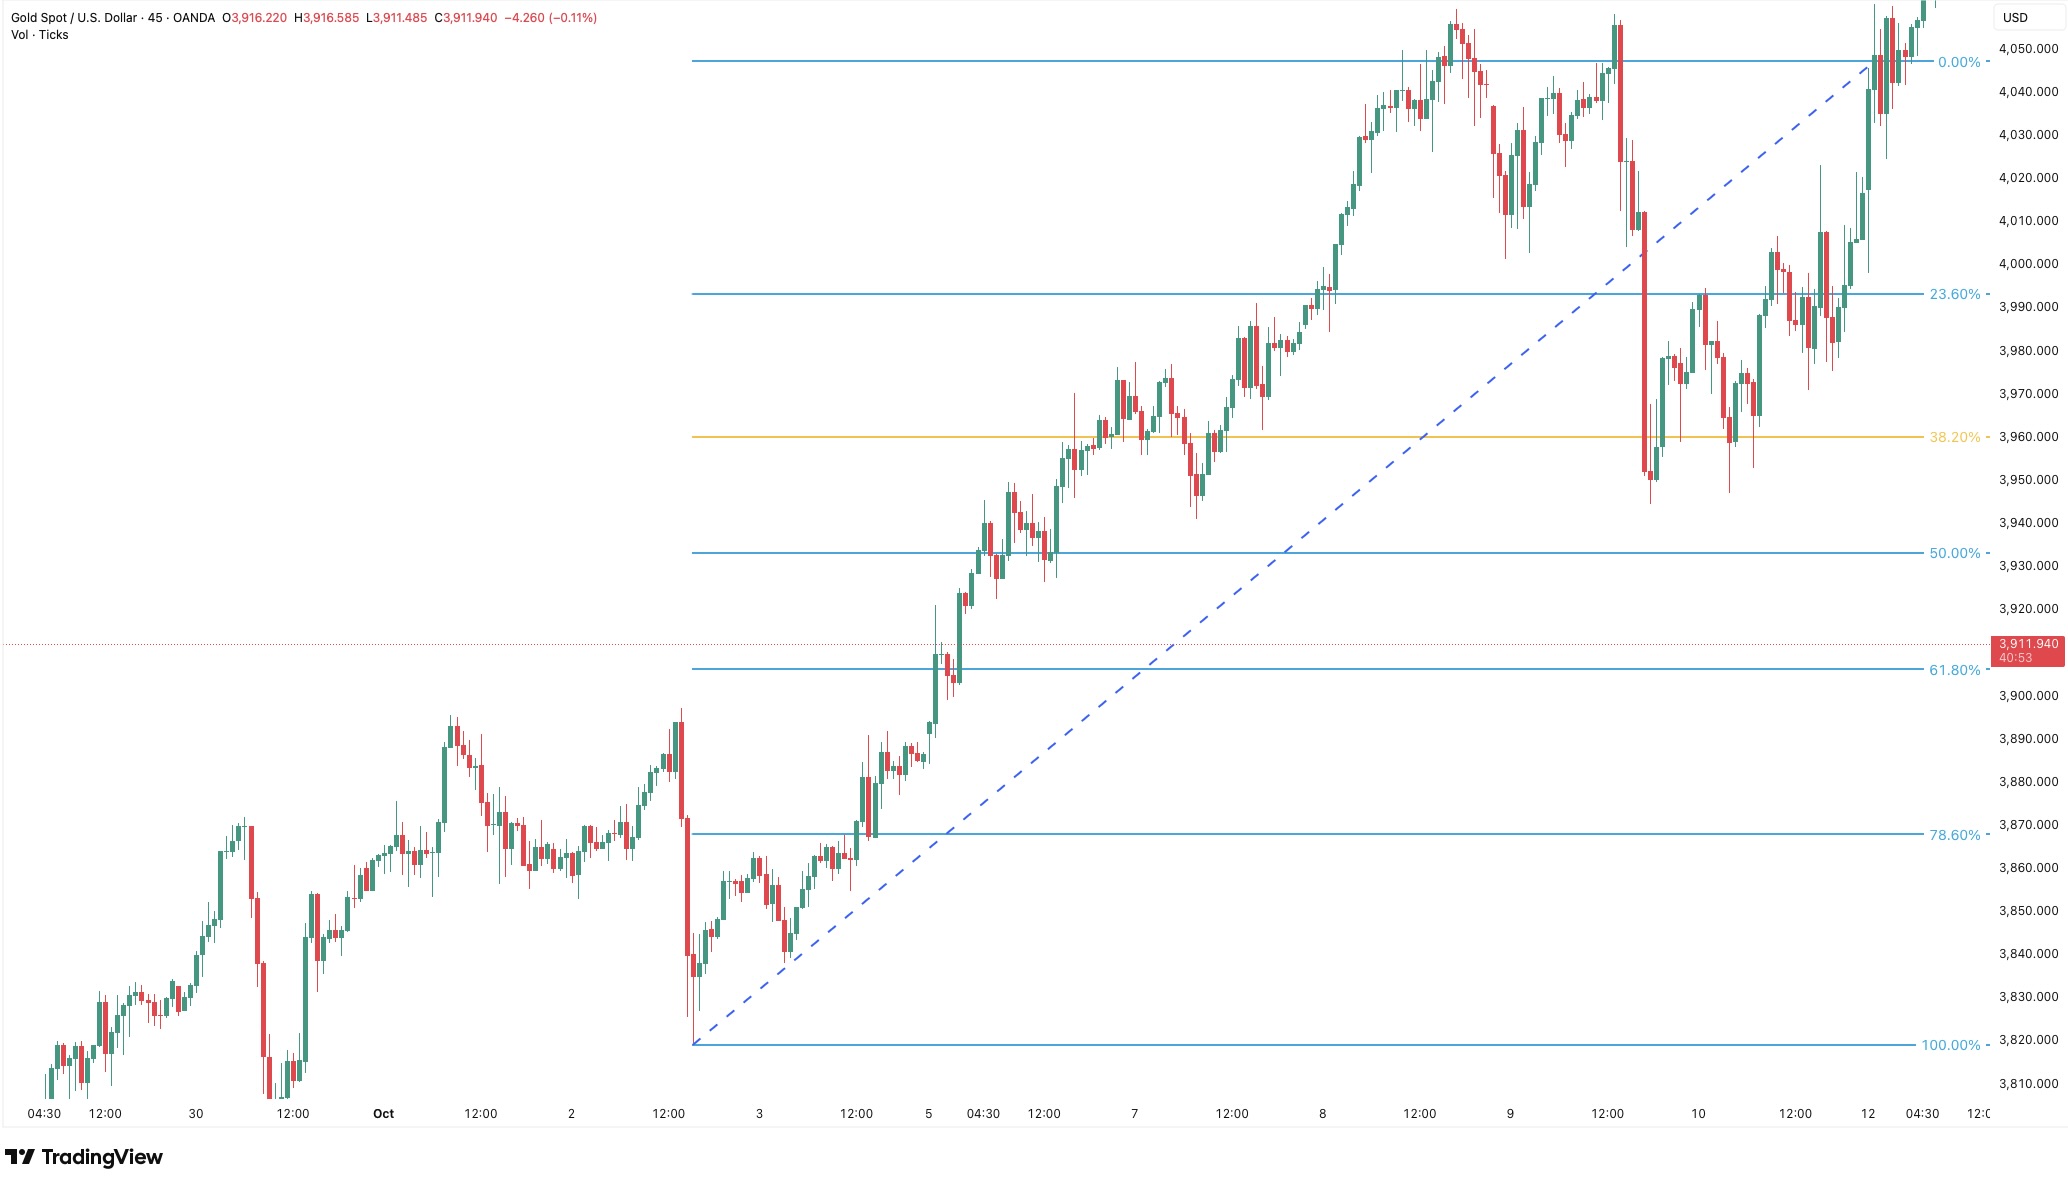
38.2% Fib Level example
In this example the price drops straight through the 23.6% level but finds support at the 38.2% level instead before resuming its uptrend.
 Source: TradingView. This example is for illustration purposes only and does not constitute financial advice. Past performance is not indicative of future results.
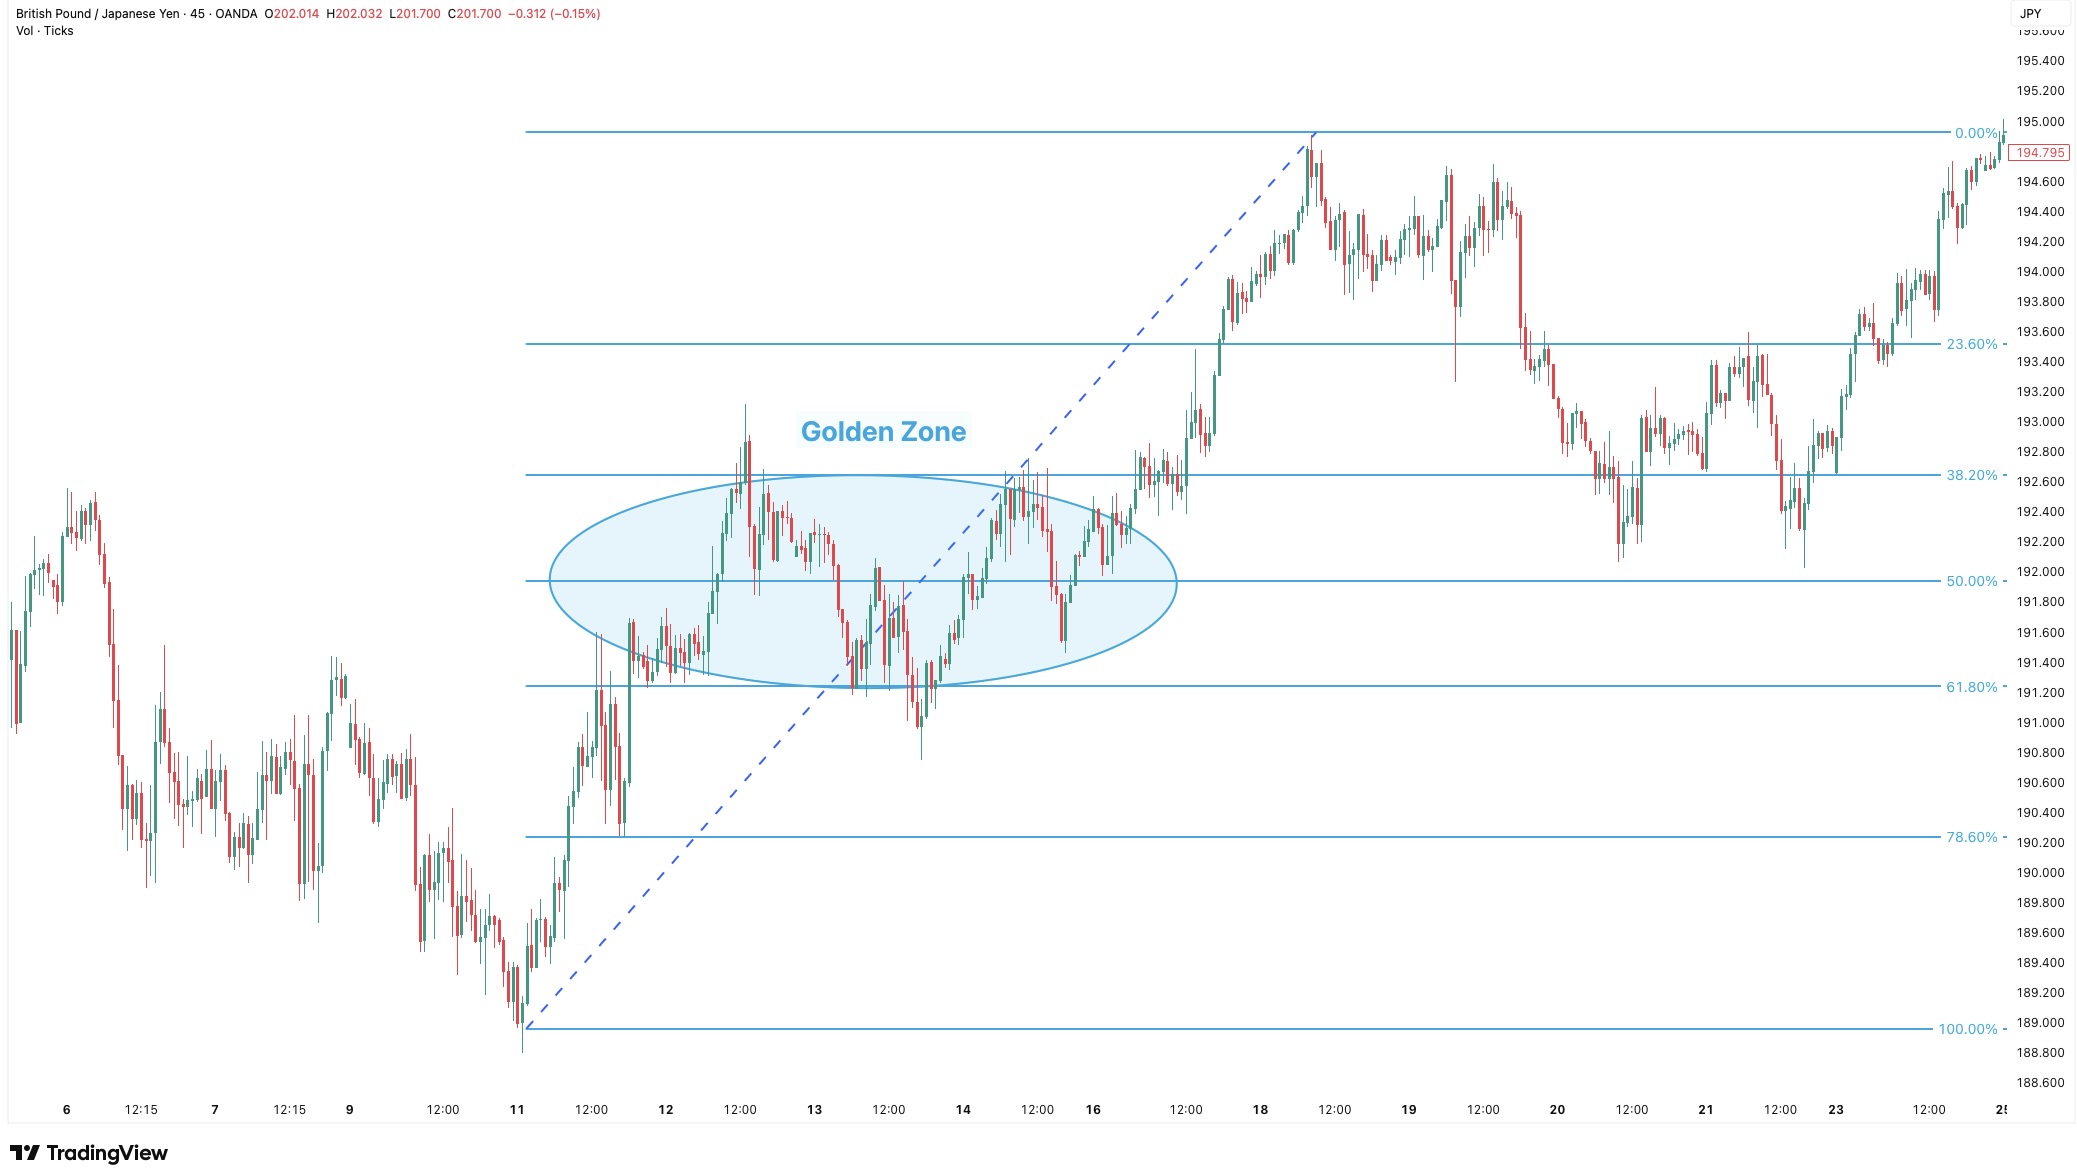
61.8% Fib Level example
Many traders refer to the zone between the 38.2% and 61.8% retracement levels, often including the 50% level (though not a true Fibonacci number), as the golden zone, where price reversals often occur.
 Source: TradingView. This example is for illustration purposes only and does not constitute financial advice. Past performance is not indicative of future results.
What is the Fibonacci Golden Ratio?
DEFINITION
The Golden Ratio of approximately 1.618 and its inverse (roughly 0.618), appears frequently in the Fibonacci sequence and forms the basis for many of the percentages used in Fibonacci trading tools.
It is found by dividing one number in the Fibonacci sequence by the number that follows it. As the numbers increase, the result approaches 0.618
It is found by dividing one number in the Fibonacci sequence by the number that follows it. As the numbers increase, the result approaches 0.618
It is also where price is often observed for signs of continuation or reversal. The 161.8% level, sometimes used in Fibonacci extension tools, is drawn beyond the recent high or low and may highlight potential target zones.
Beyond markets, this same ratio appears in nature, design, and art — from seashells to architecture — which partly explains its continued appeal among chart technicians.
Beyond markets, this same ratio appears in nature, design, and art — from seashells to architecture — which partly explains its continued appeal among chart technicians.
Fibonacci extensions
Fibonacci extensions are an additional part of the Fibonacci toolkit, used to identify possible price targets beyond the recent high or low. While retracement levels look at how far a price might pull back, extension levels suggest how far it could potentially continue in the same direction after a retracement.
Common Fibonacci extension levels include 127.2%, 161.8%, and 261.8%. These are calculated using the same Fibonacci ratios, applied beyond the original price range. Traders sometimes use extensions to outline potential areas of interest for exits or to gauge how far a trend may run — again, without assuming certainty in the result.
Common Fibonacci extension levels include 127.2%, 161.8%, and 261.8%. These are calculated using the same Fibonacci ratios, applied beyond the original price range. Traders sometimes use extensions to outline potential areas of interest for exits or to gauge how far a trend may run — again, without assuming certainty in the result.
How to use the Fibonacci retracement in CFD trading
Applying the Fibonacci retracement tool is straightforward on most charting platforms. Here is a general step-by-step approach:
- Identify a clear move in price: This could be a strong upward trend or a noticeable drop. The more distinct the movement, the more meaningful the retracement levels may appear.
- Select the Fibonacci retracement tool: This is usually found in the drawing tools or under the indicator section of most platforms.
- Click at the beginning of the move: For an uptrend, this would be the low point before the rise. For a downtrend, it would be the high point before the drop.
- Drag the tool to the end of the move: In an uptrend, drag it to the recent high. In a downtrend, drag it to the recent low.
- Release to apply the lines: The tool will automatically generate horizontal lines at the key Fibonacci levels: 23.6%, 38.2%, 50%, 61.8%, and 78.6%.
Once placed, these levels stay fixed unless you adjust the start and end points. Traders often observe how price behaves around these levels, especially during a retracement, to get a sense of potential support, resistance, or continuation.
Fibonacci indicators and trading strategy
You might rightly be questioning by this point - which Fibonacci level should I use? How can I know which one to use in advance i.e. without the benefit of hindsight seeing the chart bounce off the level?
What you must appreciate is that Fibonacci retracements are properly used as part of a broader technical trading strategy, not as a standalone signal.
Experienced CFD traders apply Fibonacci lines to identify potential areas of interest (or to add confirmation to what was already an area of interest) then look to other tools to assess price strength or confirm direction.
Fibonacci is ideally used as part of a trading strategy using the following three core elements:
Entry and exit points
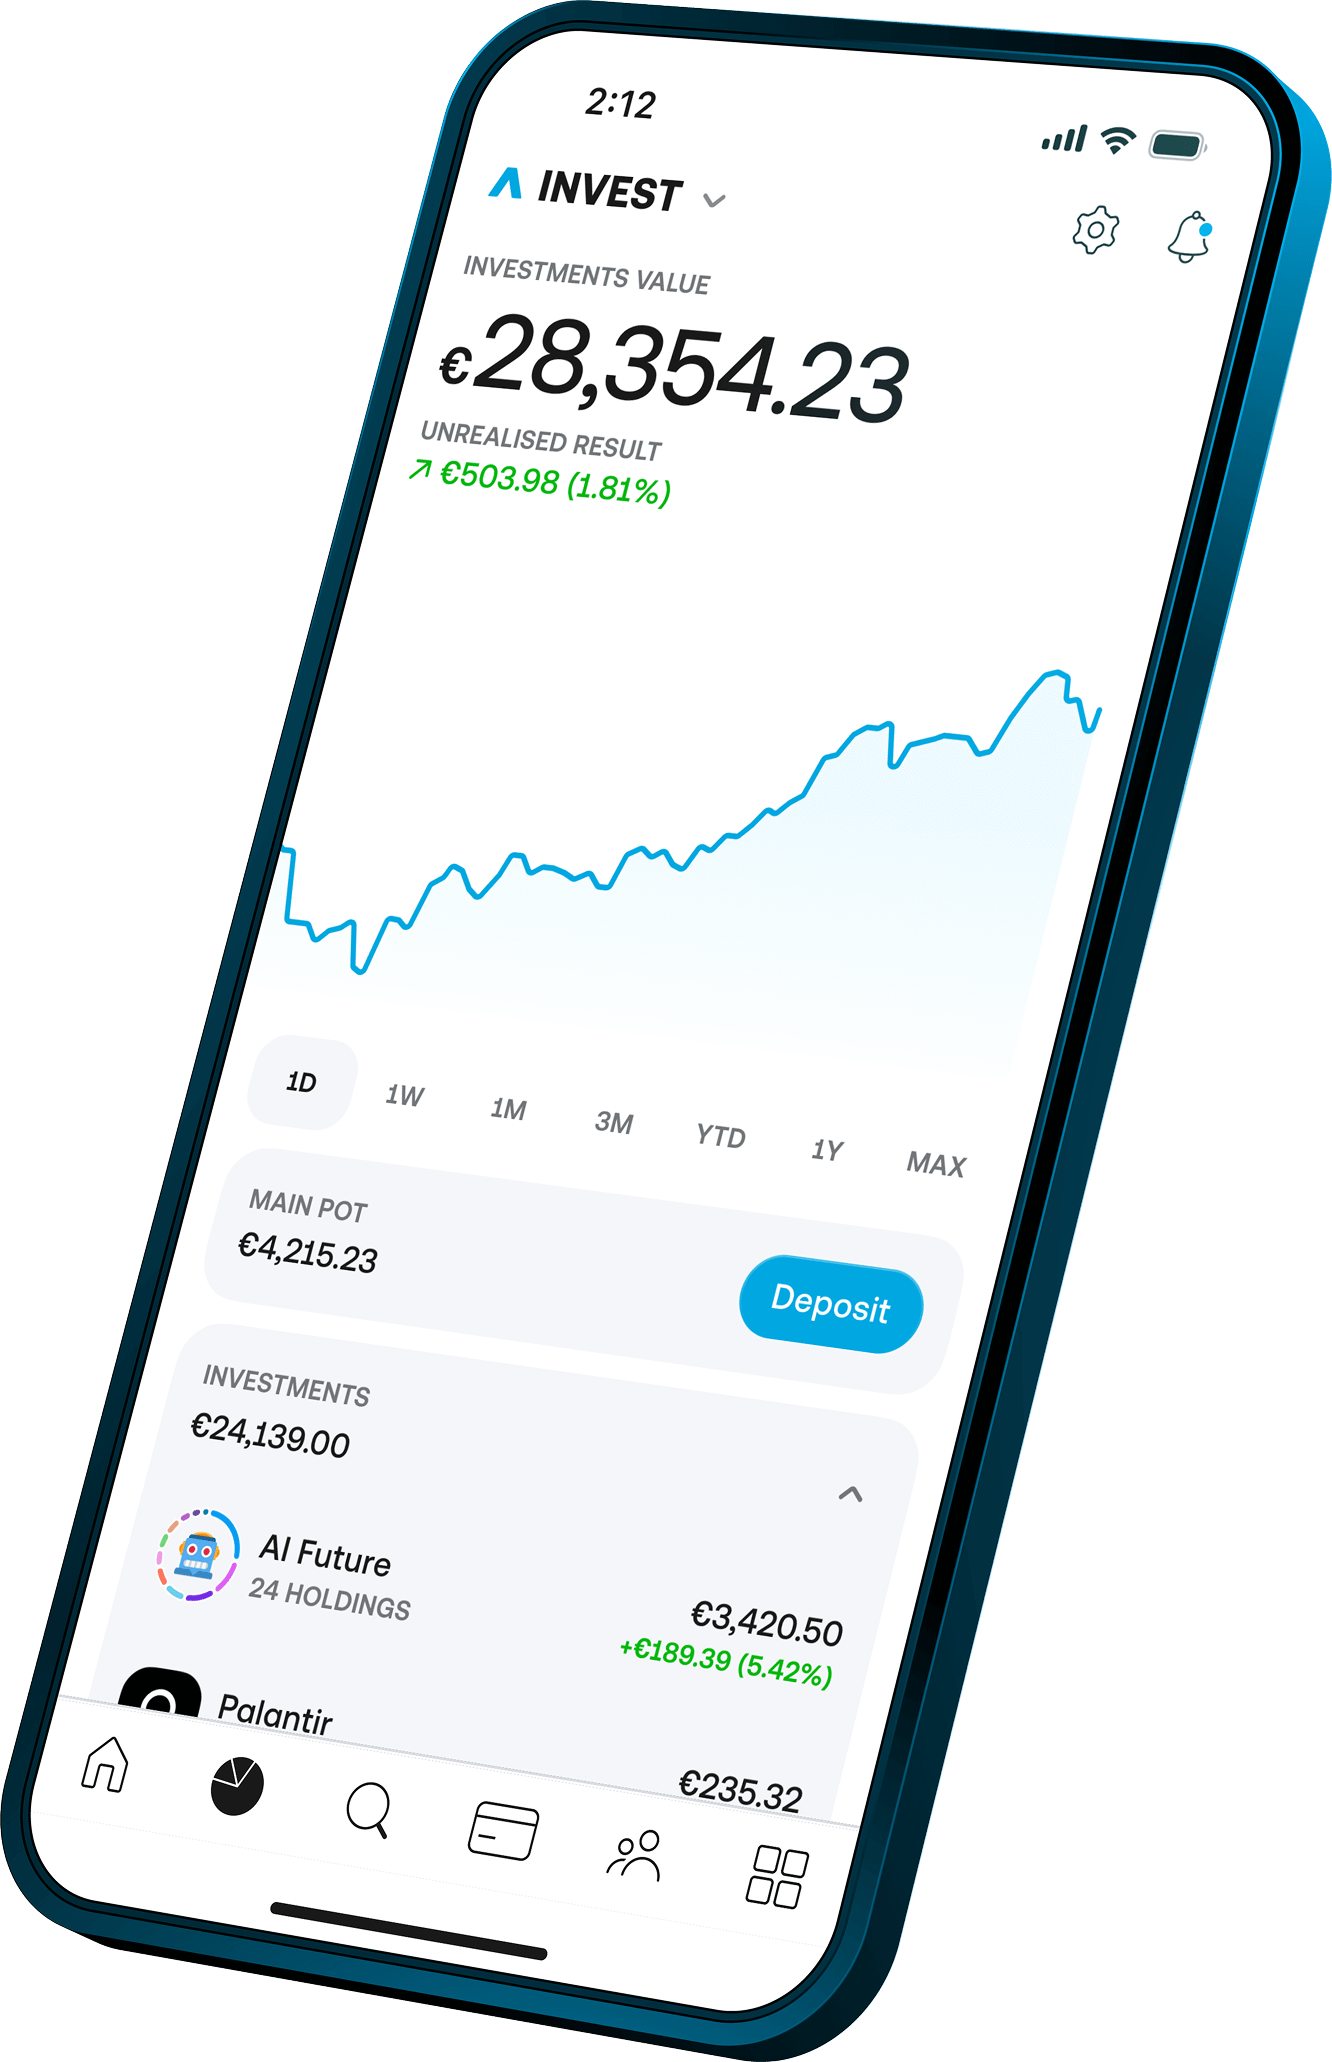
Once you have identified a trading opportunity like a potential buy setup based on fundamental research or a trend-following approach, a Fibonacci retracement can be used simply to plan entry and exit points.
It is not a method for finding what to trade, but rather a way to pick out a possible value area within a market you have already decided is worth trading.
It is not a method for finding what to trade, but rather a way to pick out a possible value area within a market you have already decided is worth trading.
 Source: Trading 212. This example is for illustration purposes only and does not constitute financial advice. Past performance is not indicative of future results.
By applying the retracement tool to a recent price move, you can highlight key zones, such as the 50% or 61.8% levels for possible entry points, then once a trade is placed, the Fibonacci extension levels offer possible exit points.
Technical indicators
Fibonacci tools are well suited to being used alongside indicators like the Relative Strength Index (RSI), MACD, or moving averages.
The goal is partly to confirm the possible validity of the Fibonacci lines, but also to build a broader picture. If price approaches a Fibonacci level and RSI shows an overbought or oversold condition, some may view that as a point worth observing. The same applies to MACD crossovers or price touching a long-term moving average as possible support near a Fibonacci retracement.
The goal is partly to confirm the possible validity of the Fibonacci lines, but also to build a broader picture. If price approaches a Fibonacci level and RSI shows an overbought or oversold condition, some may view that as a point worth observing. The same applies to MACD crossovers or price touching a long-term moving average as possible support near a Fibonacci retracement.
Price analysis
Ultimately price should always be the first consideration in any trading strategy. Fibonacci retracement helps traders focus on specific price zones rather than the entire chart.
- Identifying the trend: If price is trending lower and then bounces, the retracement tool helps frame how strong the rebound is relative to the trend that has just happened.
- Candlestick patterns: You can improve the probability that a candlestick pattern works but selectively only looking at the patterns that occur at key levels, such as Fibonacci retracements.
- Confirming support & resistance: Should a Fibonacci level align with a support or resistance level, it acts as a confluence whereby the same price is interpreted as important for multiple reasons.
Why are Fibonacci retracements important in CFD trading?
It would be a mistake to dismiss Fibonacci simply because you think the maths is too esoteric to be readily applicable to financial markets. A quick backtest of your favourite instruments from high-flying tech stocks to forex and CFDs may indicate that many major turning points happen at or near Fibonacci levels.
On a practical level, Fibonacci retracements are widely used in CFD trading because they offer a simple way to add structure to price analysis without relying on lagging indicators. By highlighting potential support and resistance zones based on past price moves, the tool gives traders reference points to think ahead of time where they might want to enter a trade to take advantage of a more favourable price.
On a practical level, Fibonacci retracements are widely used in CFD trading because they offer a simple way to add structure to price analysis without relying on lagging indicators. By highlighting potential support and resistance zones based on past price moves, the tool gives traders reference points to think ahead of time where they might want to enter a trade to take advantage of a more favourable price.
Incorporating Fibonacci retracements into your strategy
Fibonacci retracement is not a complete strategy in itself, but it can be used to support a variety of trading approaches — from short-term intraday setups to longer-term trend trading.
Using Fibonacci retracement in day trading
In day trading, where price moves quickly and decisions need to be made in shorter timeframes, Fibonacci retracement can help identify short-term pullback levels within an active trend. Traders might apply the tool on the 15-minute or 1-hour chart after a strong move and then monitor how price reacts around levels like 38.2% or 61.8%.
While the tool is often discussed in the context of CFD trading, Fibonacci retracement can be applied just as easily to charts used for share dealing or spread betting. The drawing process is the same so it is simply the underlying instrument and trade structure that differ.
Fibonacci retracement pros and cons
It is perfectly possible to trade without ever looking at Fibonacci, which many traders do because of the cons listed below, however many traders like to use them given the pros. As such, it is a personal preference whether to include them in your trading arsenal or not.
Pros | Cons |
Easy to apply on most trading platforms. | Not predictive so levels don’t guarantee a price reaction. |
Helps highlight potential support and resistance zones. | Different traders may draw levels differently. |
Works across asset classes and timeframes. | Not so useful in sideways or range-bound markets. |
Can be combined with RSI, MACD, or moving averages. | Can encourage over-analysis without a broader context. |
Provides a visual guide for planning entries and exits. | Unclear which level to use without broader analysis. |
Recap
Fibonacci retracement is a widely used charting tool in CFD trading, based on mathematical ratios found in the Fibonacci sequence. It helps identify potential support and resistance levels during the pullback from a strong price move, with key levels like 38.2%, 50%, and 61.8%. Fibonacci extensions offer additional reference points for price continuation. The tool is used across multiple timeframes and markets and is often combined with indicators like RSI or MACD. While not predictive, it adds structure to technical analysis and can support decision-making within your pre-existing trading strategy.
FAQ
Q: How to use Fibonacci retracement for support and resistance?
Apply the tool to a recent price move and observe where the retracement levels align with previous support or resistance areas. These zones may attract attention from traders, but they are not guaranteed turning points.
Q: Which indicator works best with Fibonacci?
Common pairings include RSI, MACD, and moving averages. These can help assess whether momentum supports the retracement level being observed.
Q: What are the Fibonacci support levels?
Fibonacci support levels typically refer to 38.2%, 50%, and 61.8% retracement levels. These are areas where price may pause or consolidate during a pullback.
Q: Do professional traders use Fibonacci?
Yes, many do, particularly those who use technical analysis to assess price movement. It is often used as part of a broader approach rather than in isolation.
Q: What is Fibonacci's retracement level?
It is a horizontal line drawn at a specific Fibonacci percentage of a recent price move, often used to identify possible areas of interest during a pullback.
Q: What is Fibonacci's golden zone?
This usually refers to the area between the 38.2% and 61.8% retracement levels — a range some traders view as a potentially meaningful pullback area.
Q: What is the best Fibonacci setup?
There is no single best setup. Some traders prefer shallow retracements (like 38.2%), while others focus on deeper ones (like 61.8%), depending on market conditions.
Q: What is 100% Fibonacci retracement?
It means the price has fully retraced back to the starting point of the original move — effectively erasing the entire trend being measured.
Q: What is the Fibonacci Golden Ratio?
The Golden Ratio is approximately 1.618, and its inverse (0.618) forms the basis for key Fibonacci levels used in trading tools.
Q: How to use Fibonacci retracement step by step?
Identify a clear high and low point on the chart, select the Fibonacci retracement tool, and apply it from the start to the end of the move to reveal the levels.
Q: What is the best indicator to use with Fibonacci retracement?
MACD, RSI, and moving averages are commonly used to help confirm whether price is showing strength or weakness near a retracement level.
Q: What is the best timeframe to use Fibonacci?
It depends on the trading style. Some apply it to intraday charts, while others use daily or weekly charts for longer-term analysis.