What is the Relative Strength Index (RSI) in CFD trading?

When analysing a price chart, there is a way to go one step deeper than the price itself, using momentum, essentially the speed and strength of price movements. The Relative Strength Index (RSI) is probably the most popular momentum indicator used by traders.
QUOTE
Momentum changes direction before price.
– George Lane George Lane (author, educator, and technical analyst)
– George Lane George Lane (author, educator, and technical analyst)
Big ideas
- RSI doesn't measure how strong a stock is, it measures the speed and direction of recent price moves to help gauge momentum.
- A rising RSI while price is falling (known as bullish divergence) can be an early clue that selling pressure might be fading. Vice versa for a bearish divergence.
- The default RSI setting of 14 periods comes from J. Welles Wilder, who introduced the indicator in 1978. Traders often adjust this depending on how sensitive they want the signal to be.
- RSI can swing between 0 and 100, but in strong uptrends it often stays above 40, and in strong downtrends it may rarely break above 60.
Relative Strength Index (RSI) meaning
DEFINITION
The Relative Strength Index (RSI) is typically displayed in a separate panel below price as a line that moves between values of 0 and 100. It is a technical indicator used by traders to measure momentum. Rather than focusing on the price itself, RSI looks at how quickly and in what direction price is moving over a given period.
You will often see the RSI applied to charts of stocks, indices, commodities, currency pairs, and even cryptocurrencies. The indicator is widely used by those who want a clearer sense of whether a market may be gaining or losing steam.
All that is usually needed to use the RSI indicator in your own trading is to select it from the chart tools menu in your trading app and choose the timeframe.
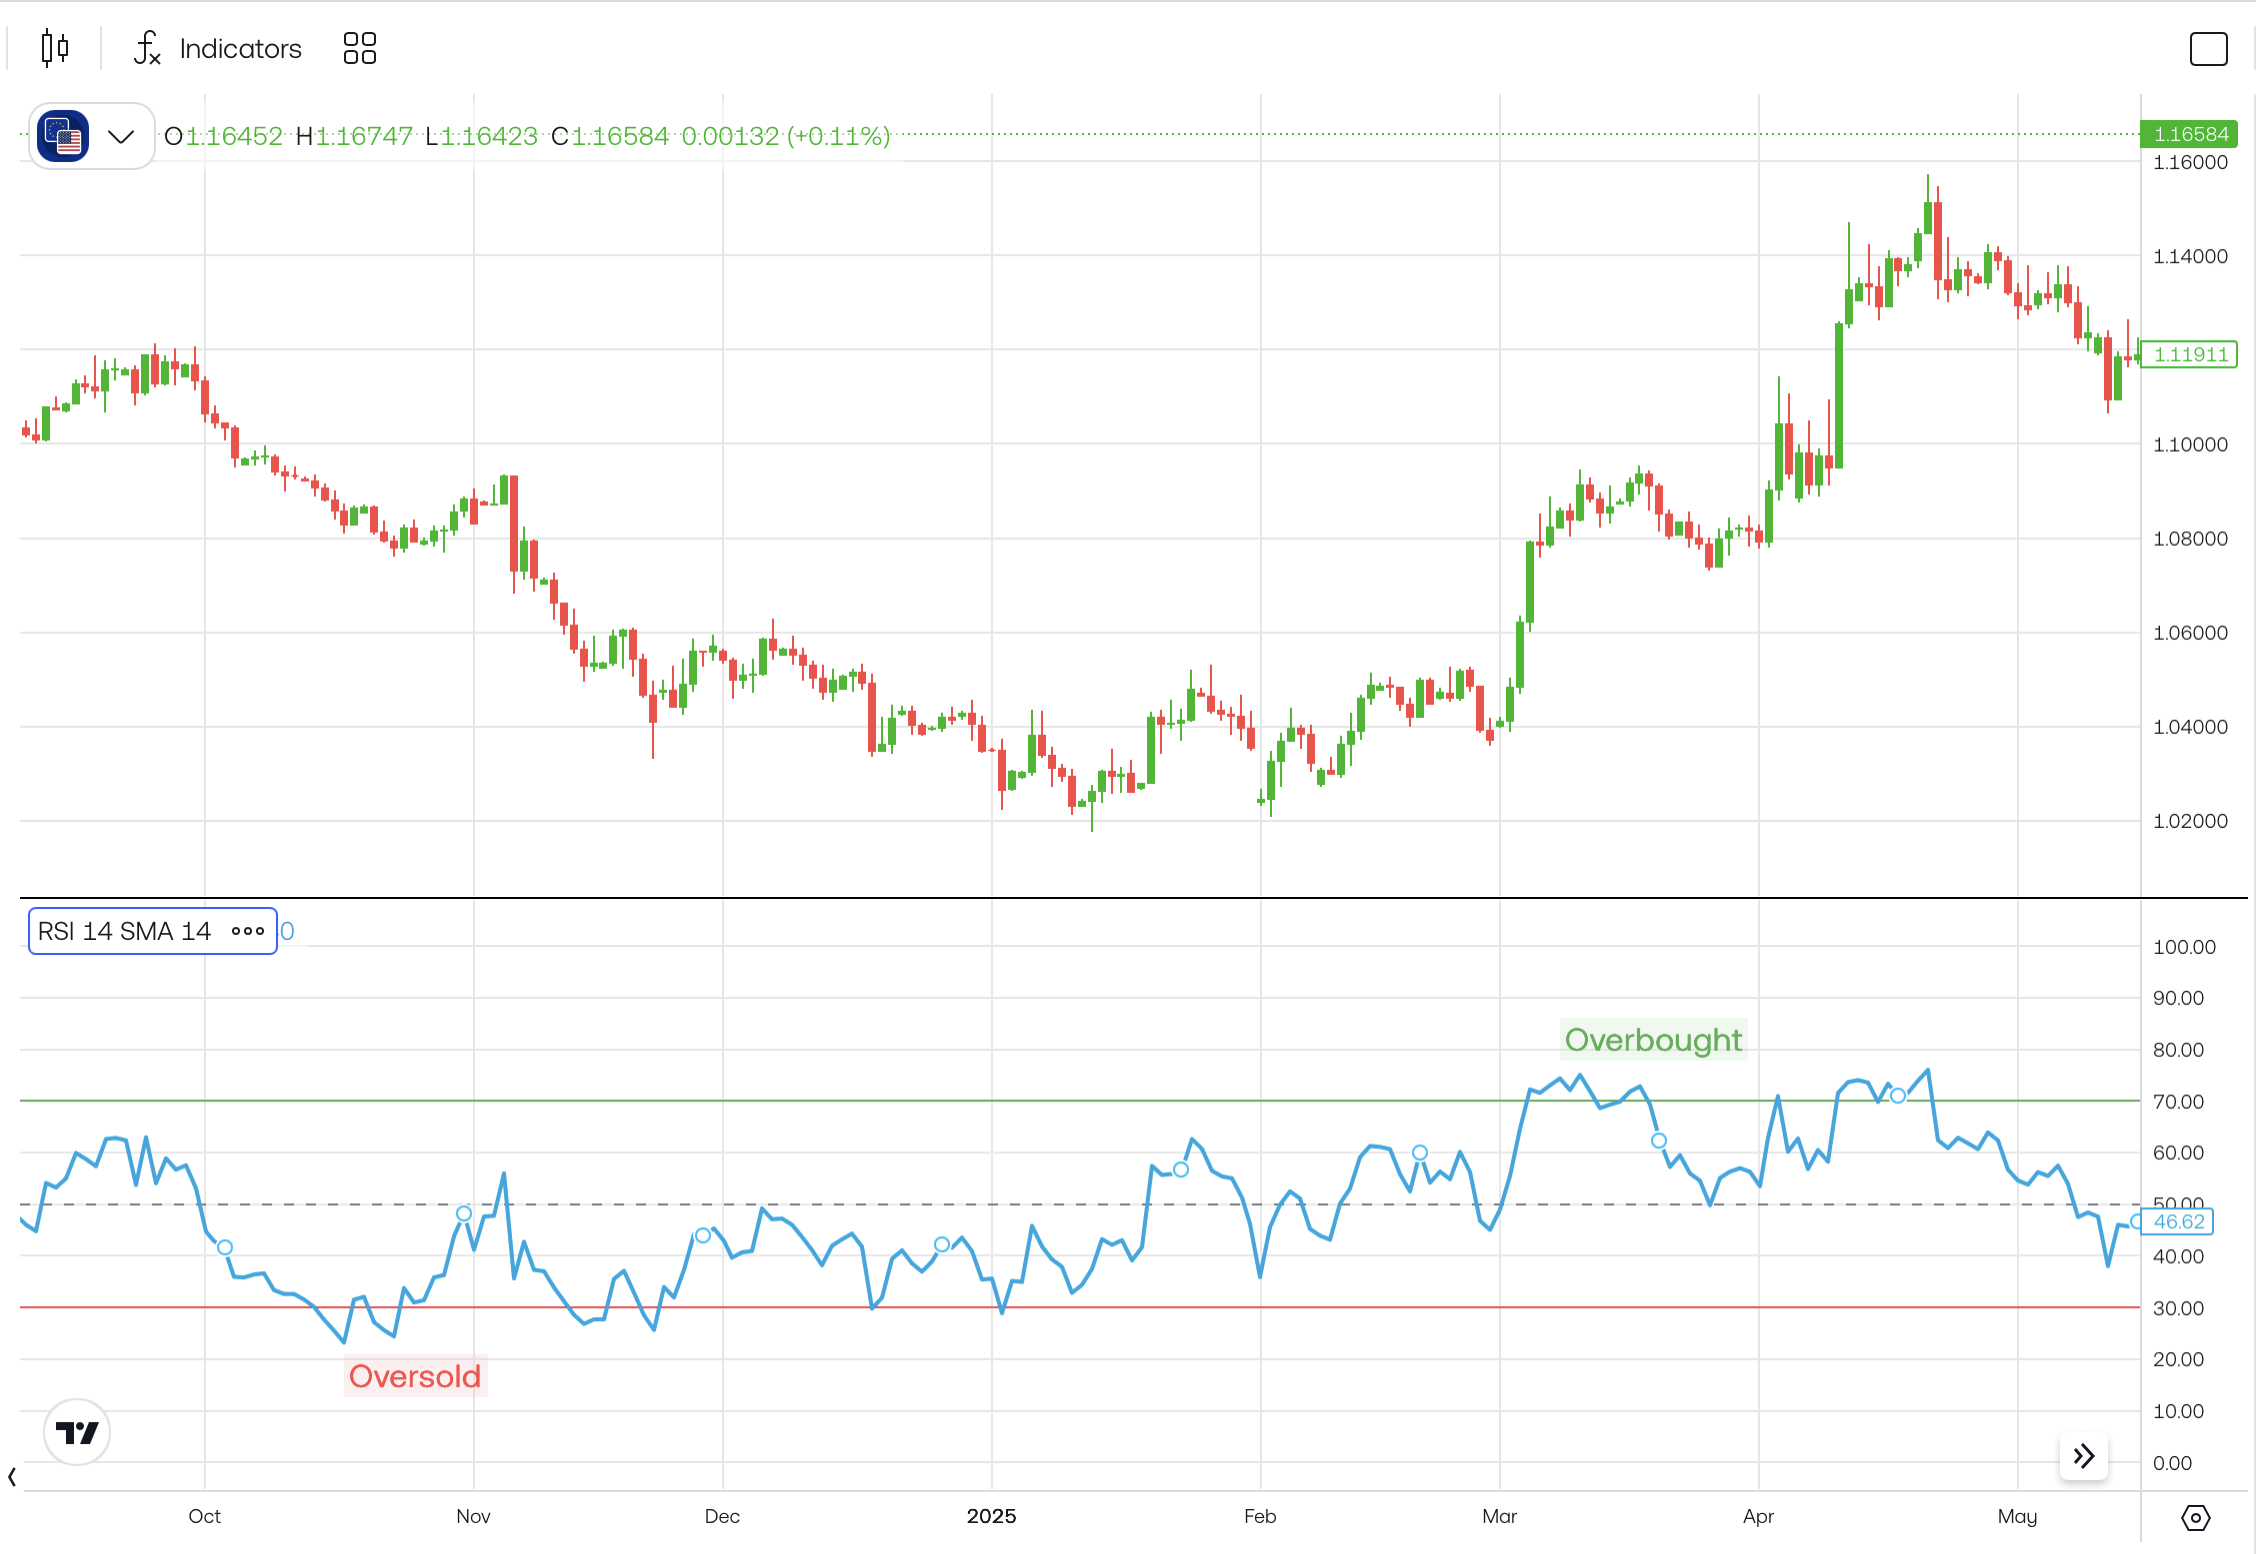
This is how it looks on a chart of GBP/USD in landscape mode on the Trading 212 app:
All that is usually needed to use the RSI indicator in your own trading is to select it from the chart tools menu in your trading app and choose the timeframe.
This is how it looks on a chart of GBP/USD in landscape mode on the Trading 212 app:
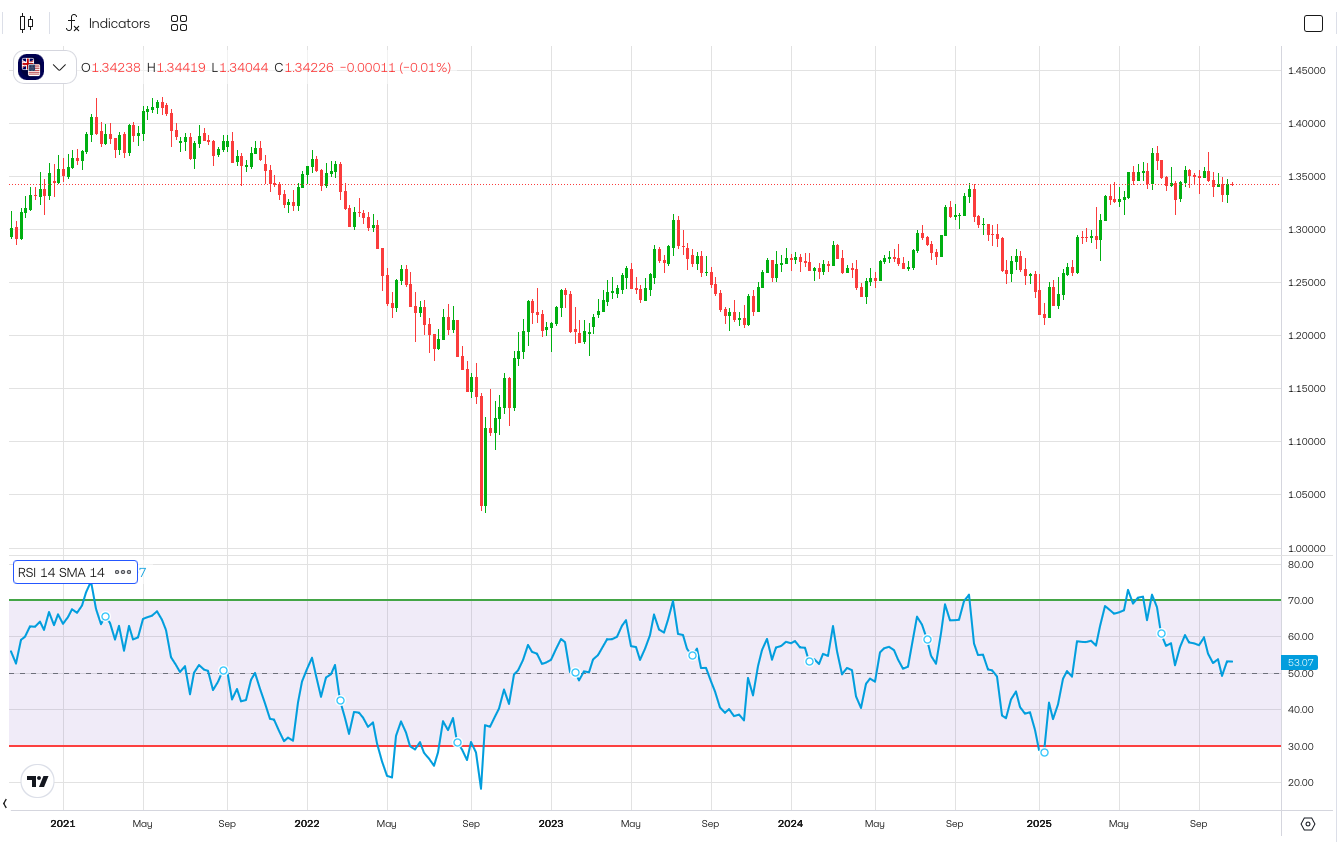 Source: Trading 212. This example is for illustration purposes only and does not constitute financial advice. Past performance is not indicative of future results.
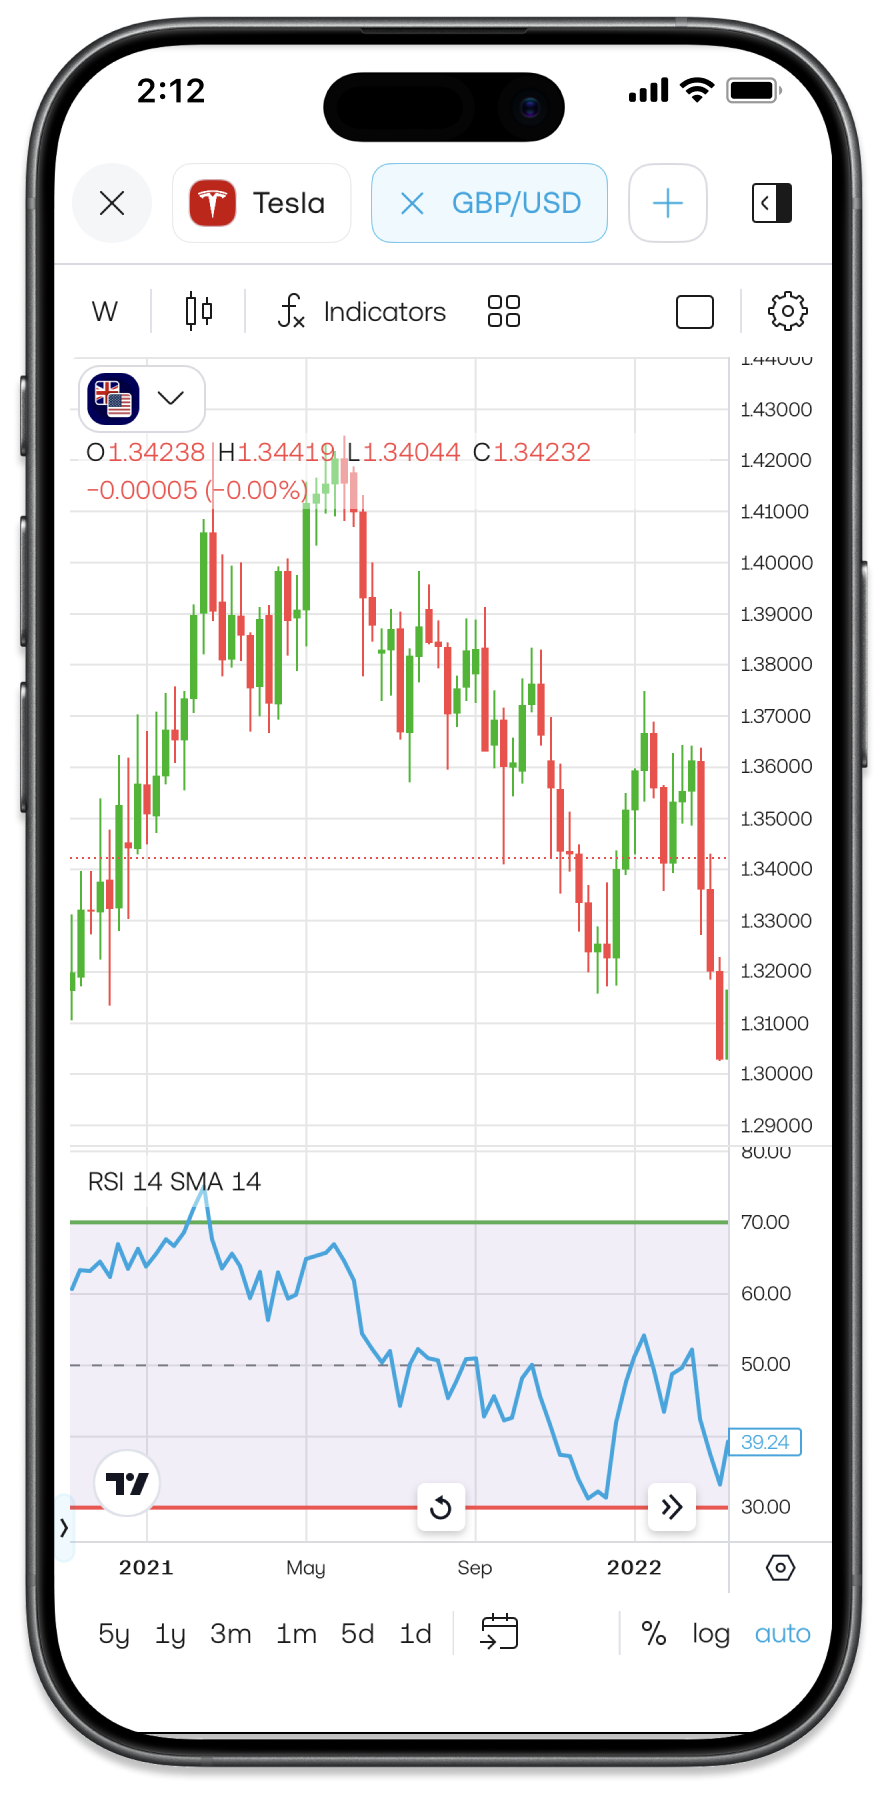
This is the same chart zoomed in, with the phone flipped in portrait mode:
 Source: Trading 212. This example is for illustration purposes only and does not constitute financial advice. Past performance is not indicative of future results.
 RSI readings can't predict where prices will go next. Instead, the indicator helps show how strong or weak recent price performance has been.
How does RSI work in CFD trading?
RSI is especially popular in CFD trading because it can help identify moments where price movements might be stretched.
What is a bullish RSI number?
A reading toward the lower end of the RSI range, where a reading under 30 is considered oversold, indicates the market has fallen rapidly. A rapid decline under some circumstances can offer a bullish opportunity to buy low but at other times it can mean there is a strong downtrend that is unlikely to turn higher anytime soon.
What is a bearish RSI number?
An RSI value approaching the higher end of its scale indicates that a market has risen a lot over a short period. A number over 70 is considered overbought. Under the right circumstances this higher RSI could suggest that the market is due a bearish turn. However, under different circumstances it could mean that there is a strong uptrend, diminishing the likelihood of any meaningful move lower.
Armed with information from the RSI that a market might have moved too far too quickly in one direction, the trader can analyse whether the market might be due to reverse in the opposite direction, providing a possible bullish or bearish entry point on a trade.
Again, it is worth remembering that RSI does not offer buy or sell instructions. It is a momentum indicator that some traders use alongside price charts to better understand recent price behaviour. In CFD trading, where leverage can amplify both gains and losses, many look to indicators like RSI to help add an additional edge to their short-term decisions.
Example: RSI of a stock
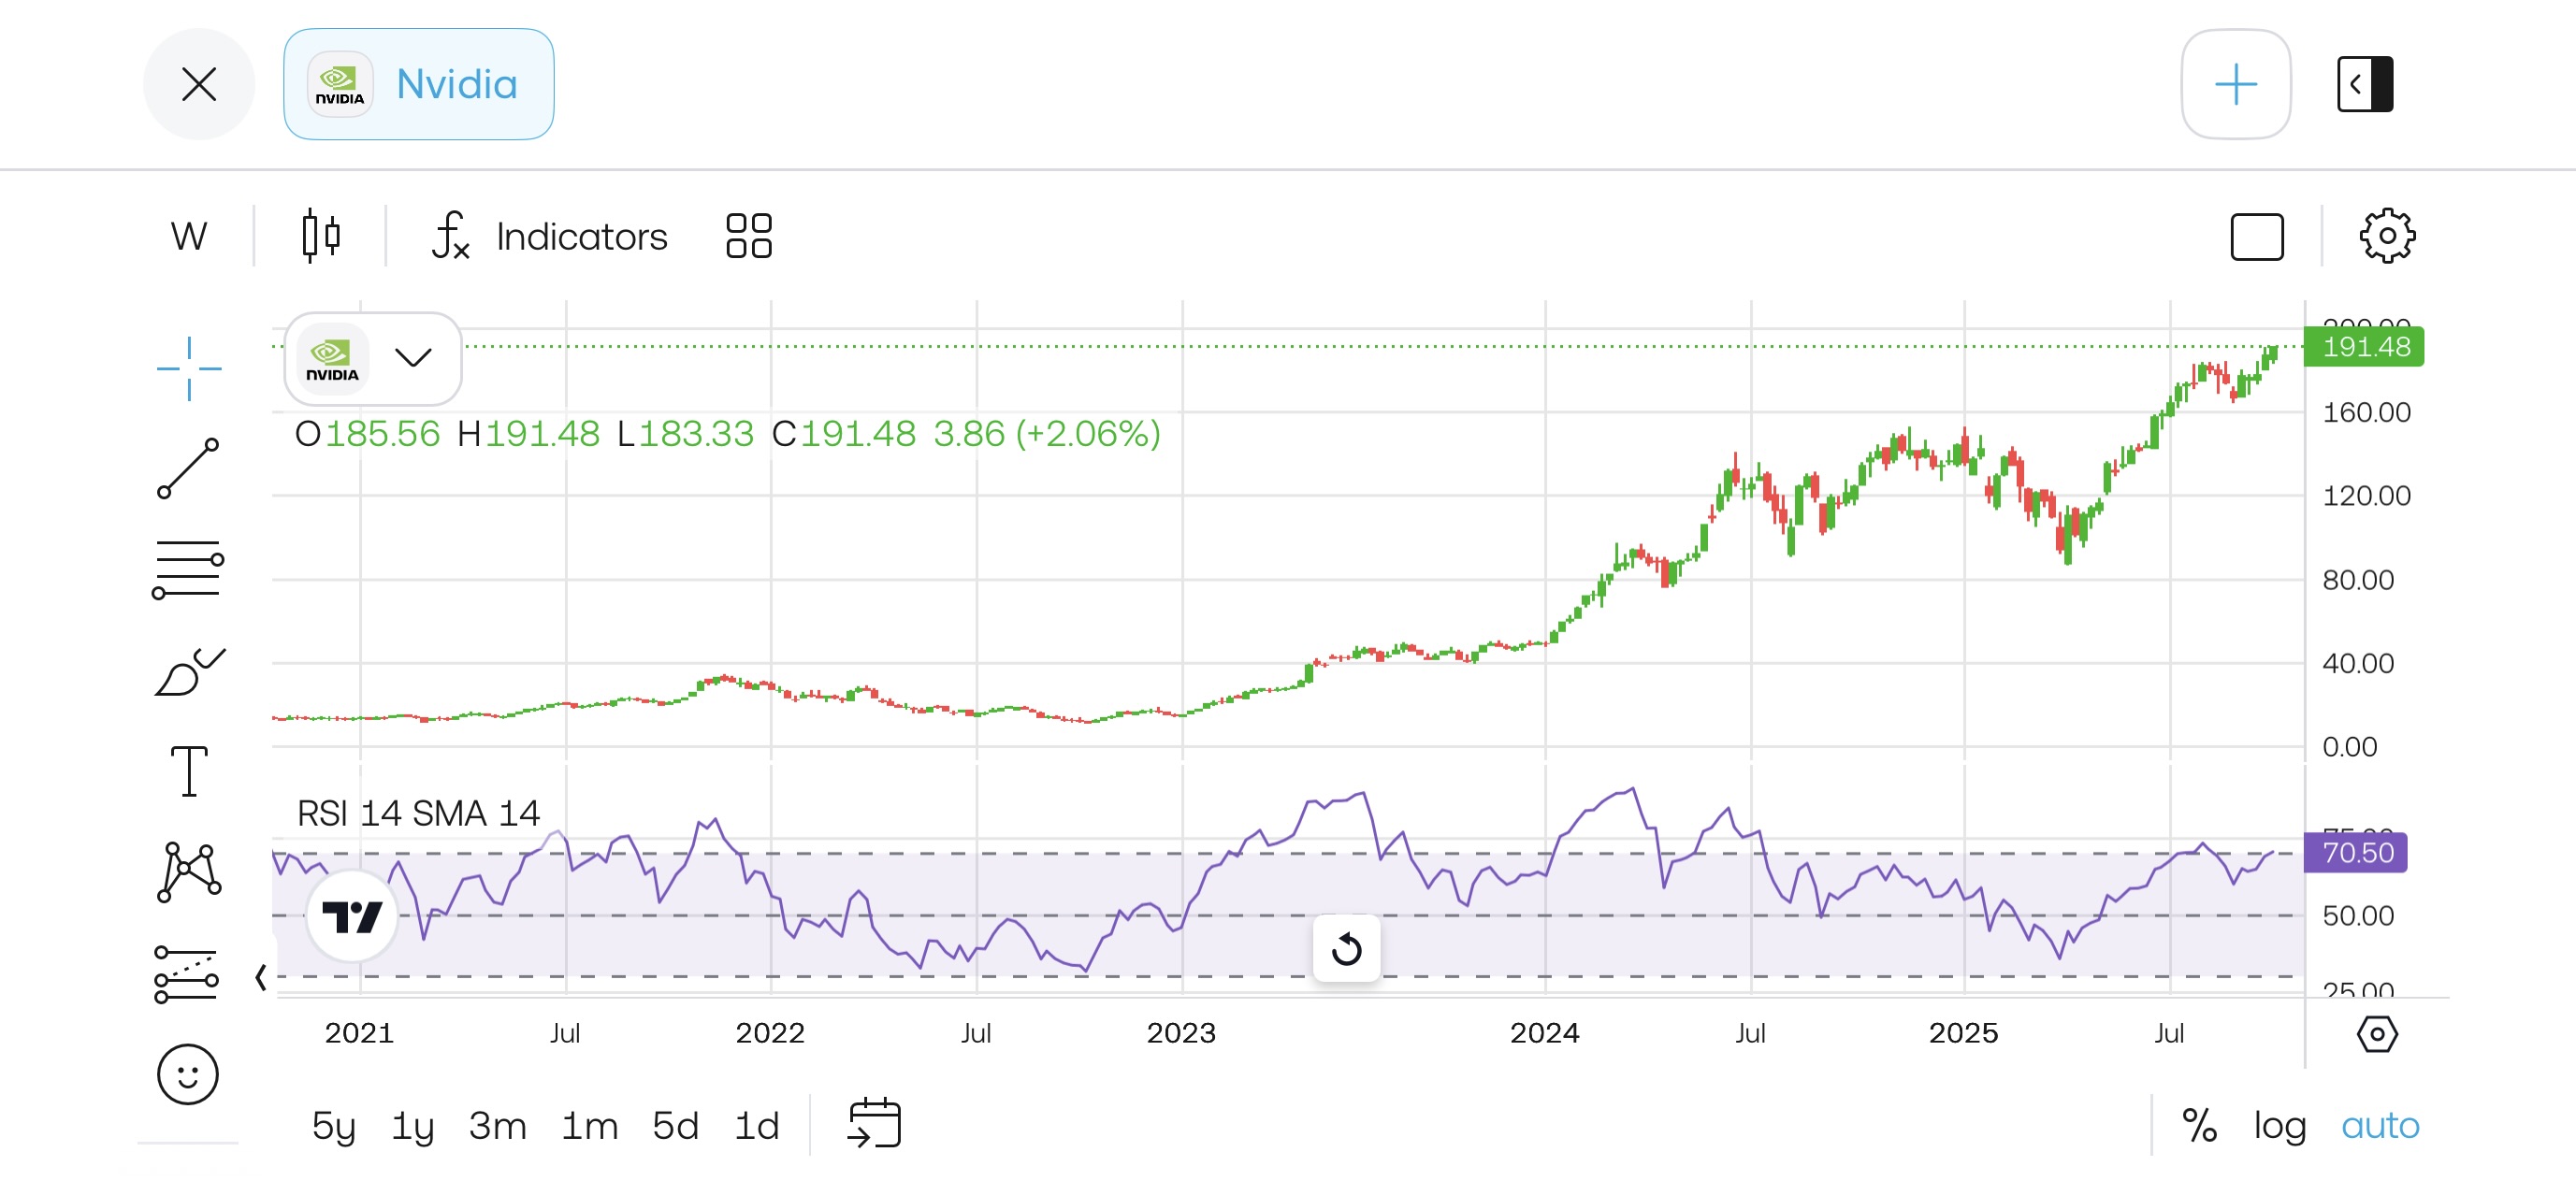
At the time of writing, Nvidia (NVDA) is the stock with the largest market capitalization in the world. Let’s choose this stock for our example, this is not buy or sell advice.
 Source: Trading 212. This example is for illustration purposes only and does not constitute financial advice. Past performance is not indicative of future results.
In the example above, the current RSI (14) reading is around 70.50. Over the past few years, the RSI level has fluctuated in line with the movement in the stock price.
How is RSI calculated? Plotting RSI on a chart
RSI is calculated using recent price data, normally across 14 periods. These can be weeks, days, hours, or minutes depending on the chart’s timeframe.
The indicator compares the average gain of upward price moves to the average loss over that period, and then converts this into a value between 0 and 100.
Fortunately, you don't need to do the maths yourself to use this indicator because almost every trading platform, including the Trading 212 app, will plot the RSI line automatically beneath the main price chart.
The formula behind RSI
The RSI formula is designed to compare the size of recent gains to recent losses over a chosen number of periods, the default is 14.
FORMULA
RSI = 100 – (100 ÷ (1 + RS))
• RS = Average Gain ÷ Average Loss
Here is what that means in practice (using the standard 14-period RSI):
• Average Gain: The average of all positive price changes over the past 14 periods (e.g. days, hours, or minutes).
• Average Loss: The average of all negative price changes over that same 14-period span, expressed as a positive number.
Here are the steps if you were to calculate it yourself:
- Calculate the average gain and the average loss over that timeframe.
- These are then used to produce the Relative Strength (RS), which is simply the ratio of average gain to average loss.
- The result is a value between 0 and 100.
That way, if prices have risen more than they have fallen, RSI moves higher. If losses outweigh gains, RSI falls. The indicator adjusts automatically as each new data point is added.
How do you read the RSI?
RSI requires some interpretation because just the RSI number in isolation has little-to-no meaning. The reading as well as past RSI readings and how they relate to the price should be incorporated to give a richer context from which to make decisions.
What does a high or low RSI indicate? It depends. For instance, whether RSI is rising while price is falling, or whether it is holding above a certain level during an uptrend, can provide extra context. Here are the 5 main ways to read RSI:
What does a high or low RSI indicate? It depends. For instance, whether RSI is rising while price is falling, or whether it is holding above a certain level during an uptrend, can provide extra context. Here are the 5 main ways to read RSI:
1. RSI ranges explained
The RSI ranges from 0 to 100, but in most market conditions, the indicator tends to move within a tighter band. A reading of 0 or 100 is considered unusual.
Commonly, RSI fluctuates between 30 and 70. These levels can also be used as a reference point when the price is trading in a sideways range.
When prices are trending strongly, those ranges will usually shift one way or the other, with readings regularly holding above 40 in uptrends or below 60 in downtrends.
Some traders use the 50 level as a general dividing line for whether to take a bullish or bearish bias, though this is not a rule.
RSI ranges are most useful when compared to historical patterns in the same market, rather than being applied as fixed thresholds across all stocks or instruments. You will even notice that RSI forms its own versions of support and resistance and even trendlines.
2. RSI levels: Overbought & Oversold conditions
One of the most familiar aspects of the Relative Strength Index is the idea of overbought and oversold levels.
- A reading above 70 (or 75) is often referred to as overbought.
- A reading below 30 (or 25) is usually seen as oversold.
 Source: Trading 212. This example is for illustration purposes only and does not constitute financial advice. Past performance is not indicative of future results.
Probably the biggest mistake made by beginners using RSI is to think too black and white about overbought and oversold. These terms don't suggest that a stock is too expensive or too cheap in any valuation sense. Instead, they reflect that price has moved quickly in one direction over the recent period. But that is not to say it can’t continue moving either quickly or slowly in the same direction for the foreseeable future.
In some cases, these levels mark points where price starts to pause or reverse. But during strong trends, RSI can remain above 70 or below 30 for some time. For that reason, traders rarely act on these readings alone. Overbought and oversold conditions can also be more effective when considered in combination with other factors like trend direction, support and resistance levels, or price structure on the chart.
In some cases, these levels mark points where price starts to pause or reverse. But during strong trends, RSI can remain above 70 or below 30 for some time. For that reason, traders rarely act on these readings alone. Overbought and oversold conditions can also be more effective when considered in combination with other factors like trend direction, support and resistance levels, or price structure on the chart.
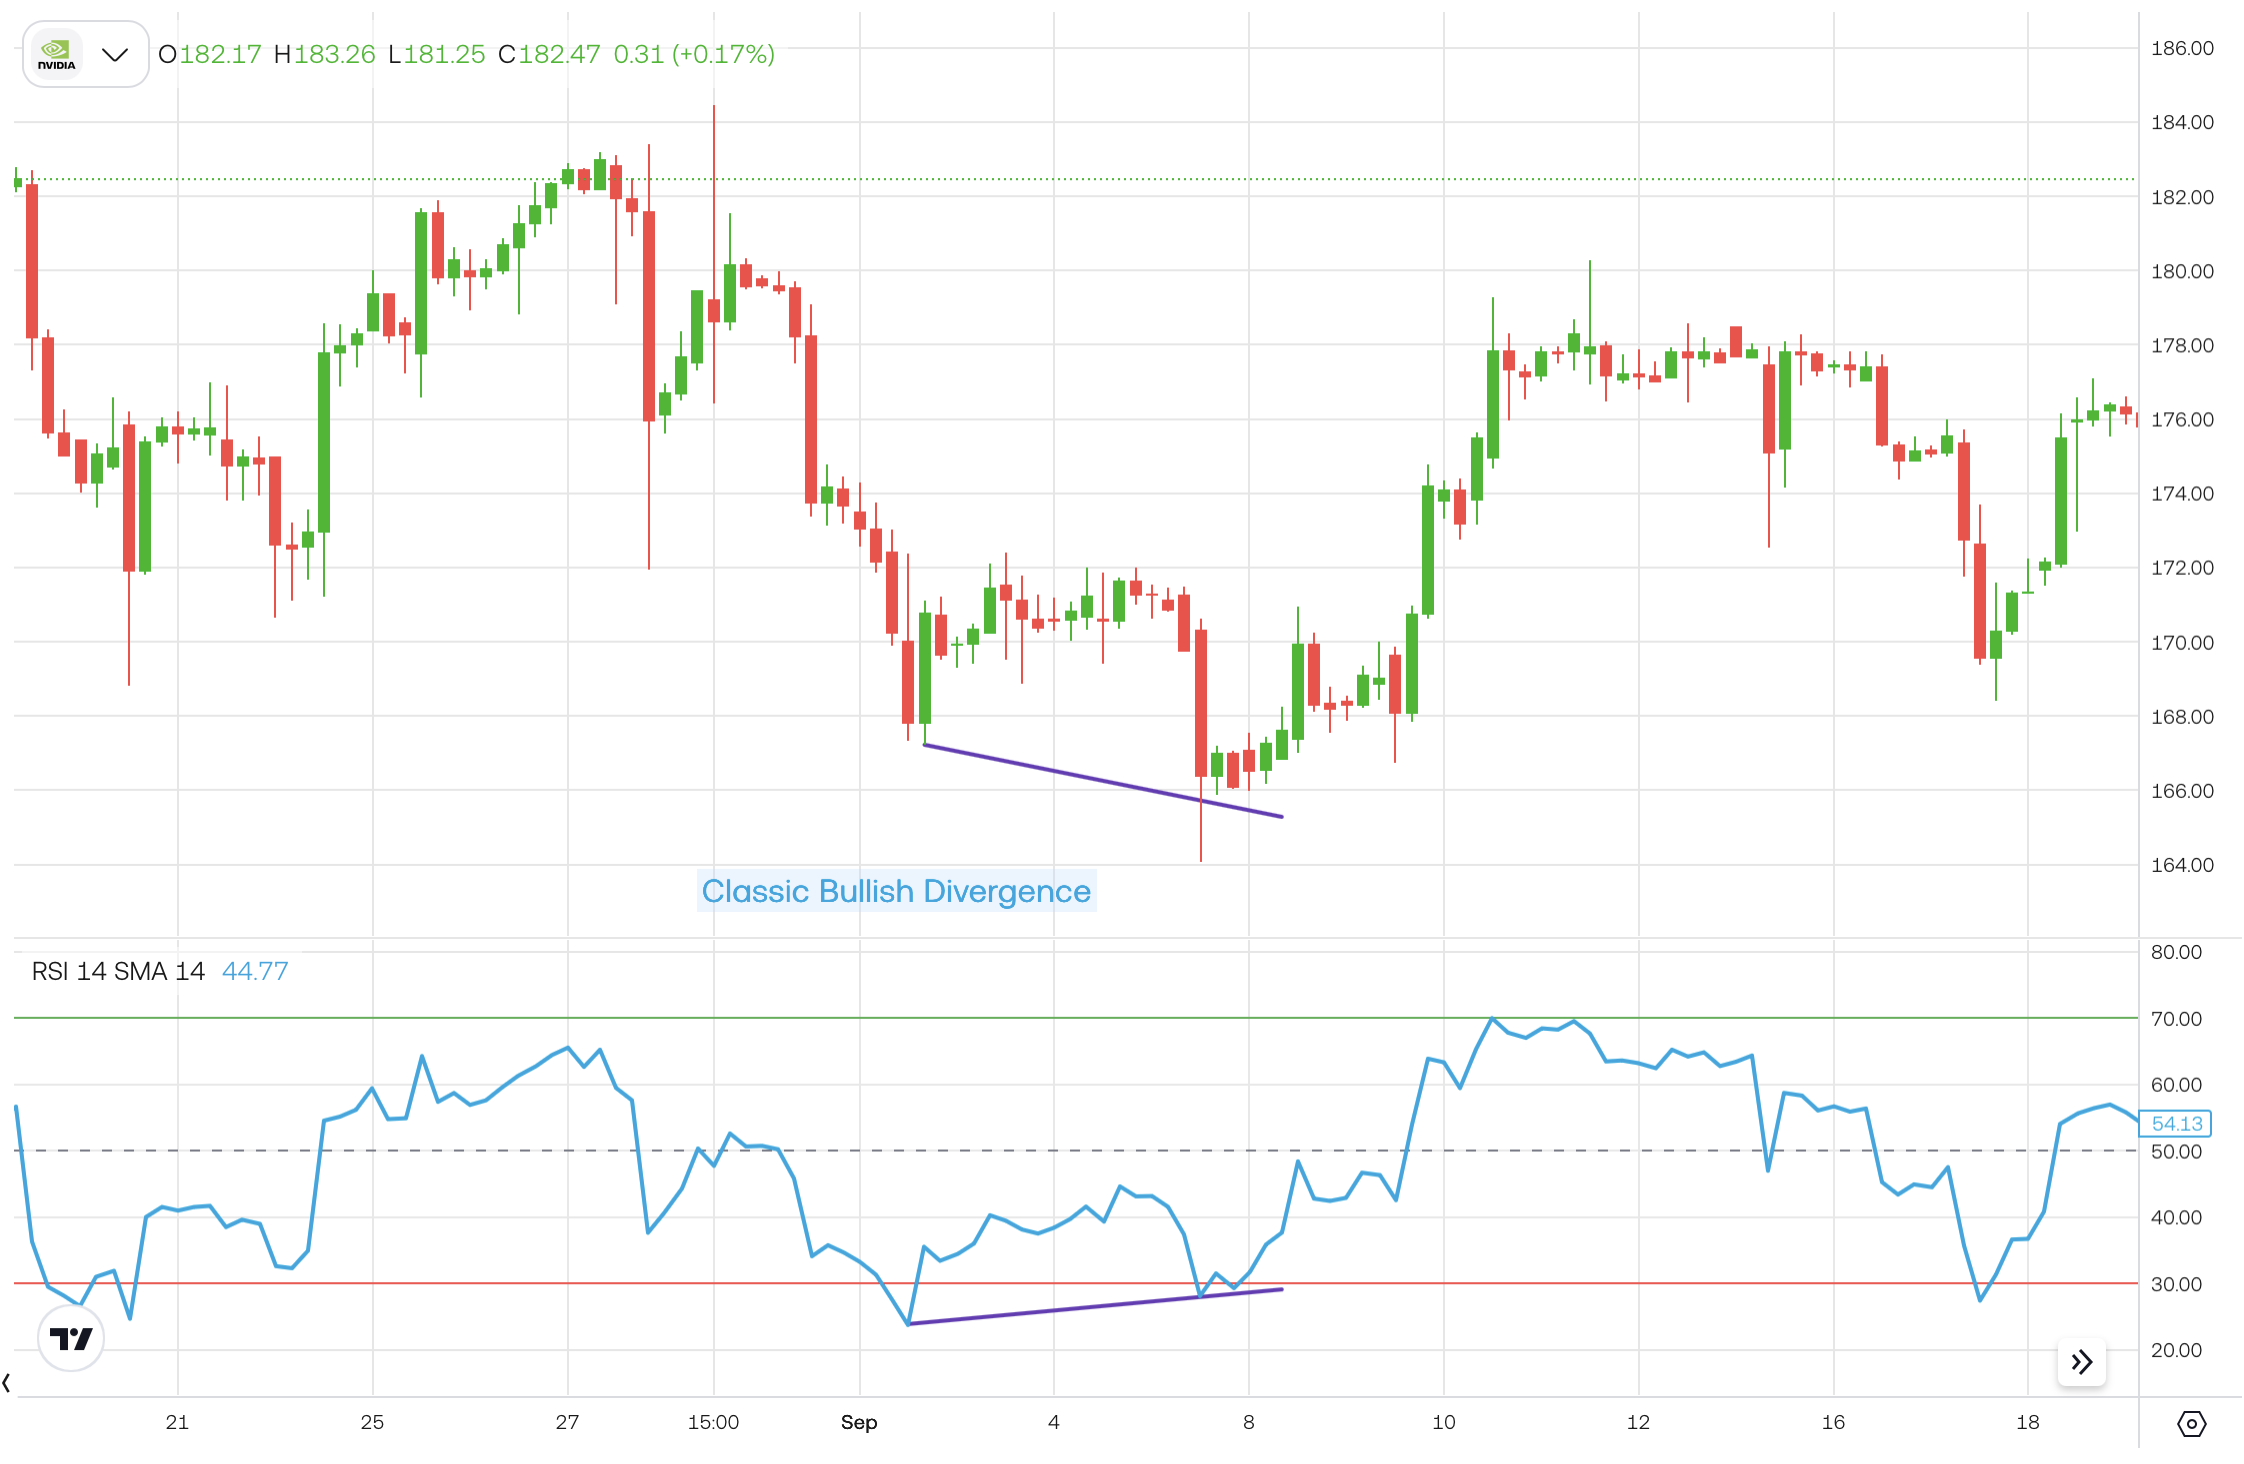
3. RSI divergence: Identifying potential market reversals
DEFINITION
RSI divergence describes a situation where the price and the RSI indicator are moving in opposite directions.
Bullish RSI divergence example
If the price falls to a new low while RSI forms a higher low, that is called bullish divergence.
 Source: Trading 212. This example is for illustration purposes only and does not constitute financial advice. Past performance is not indicative of future results.
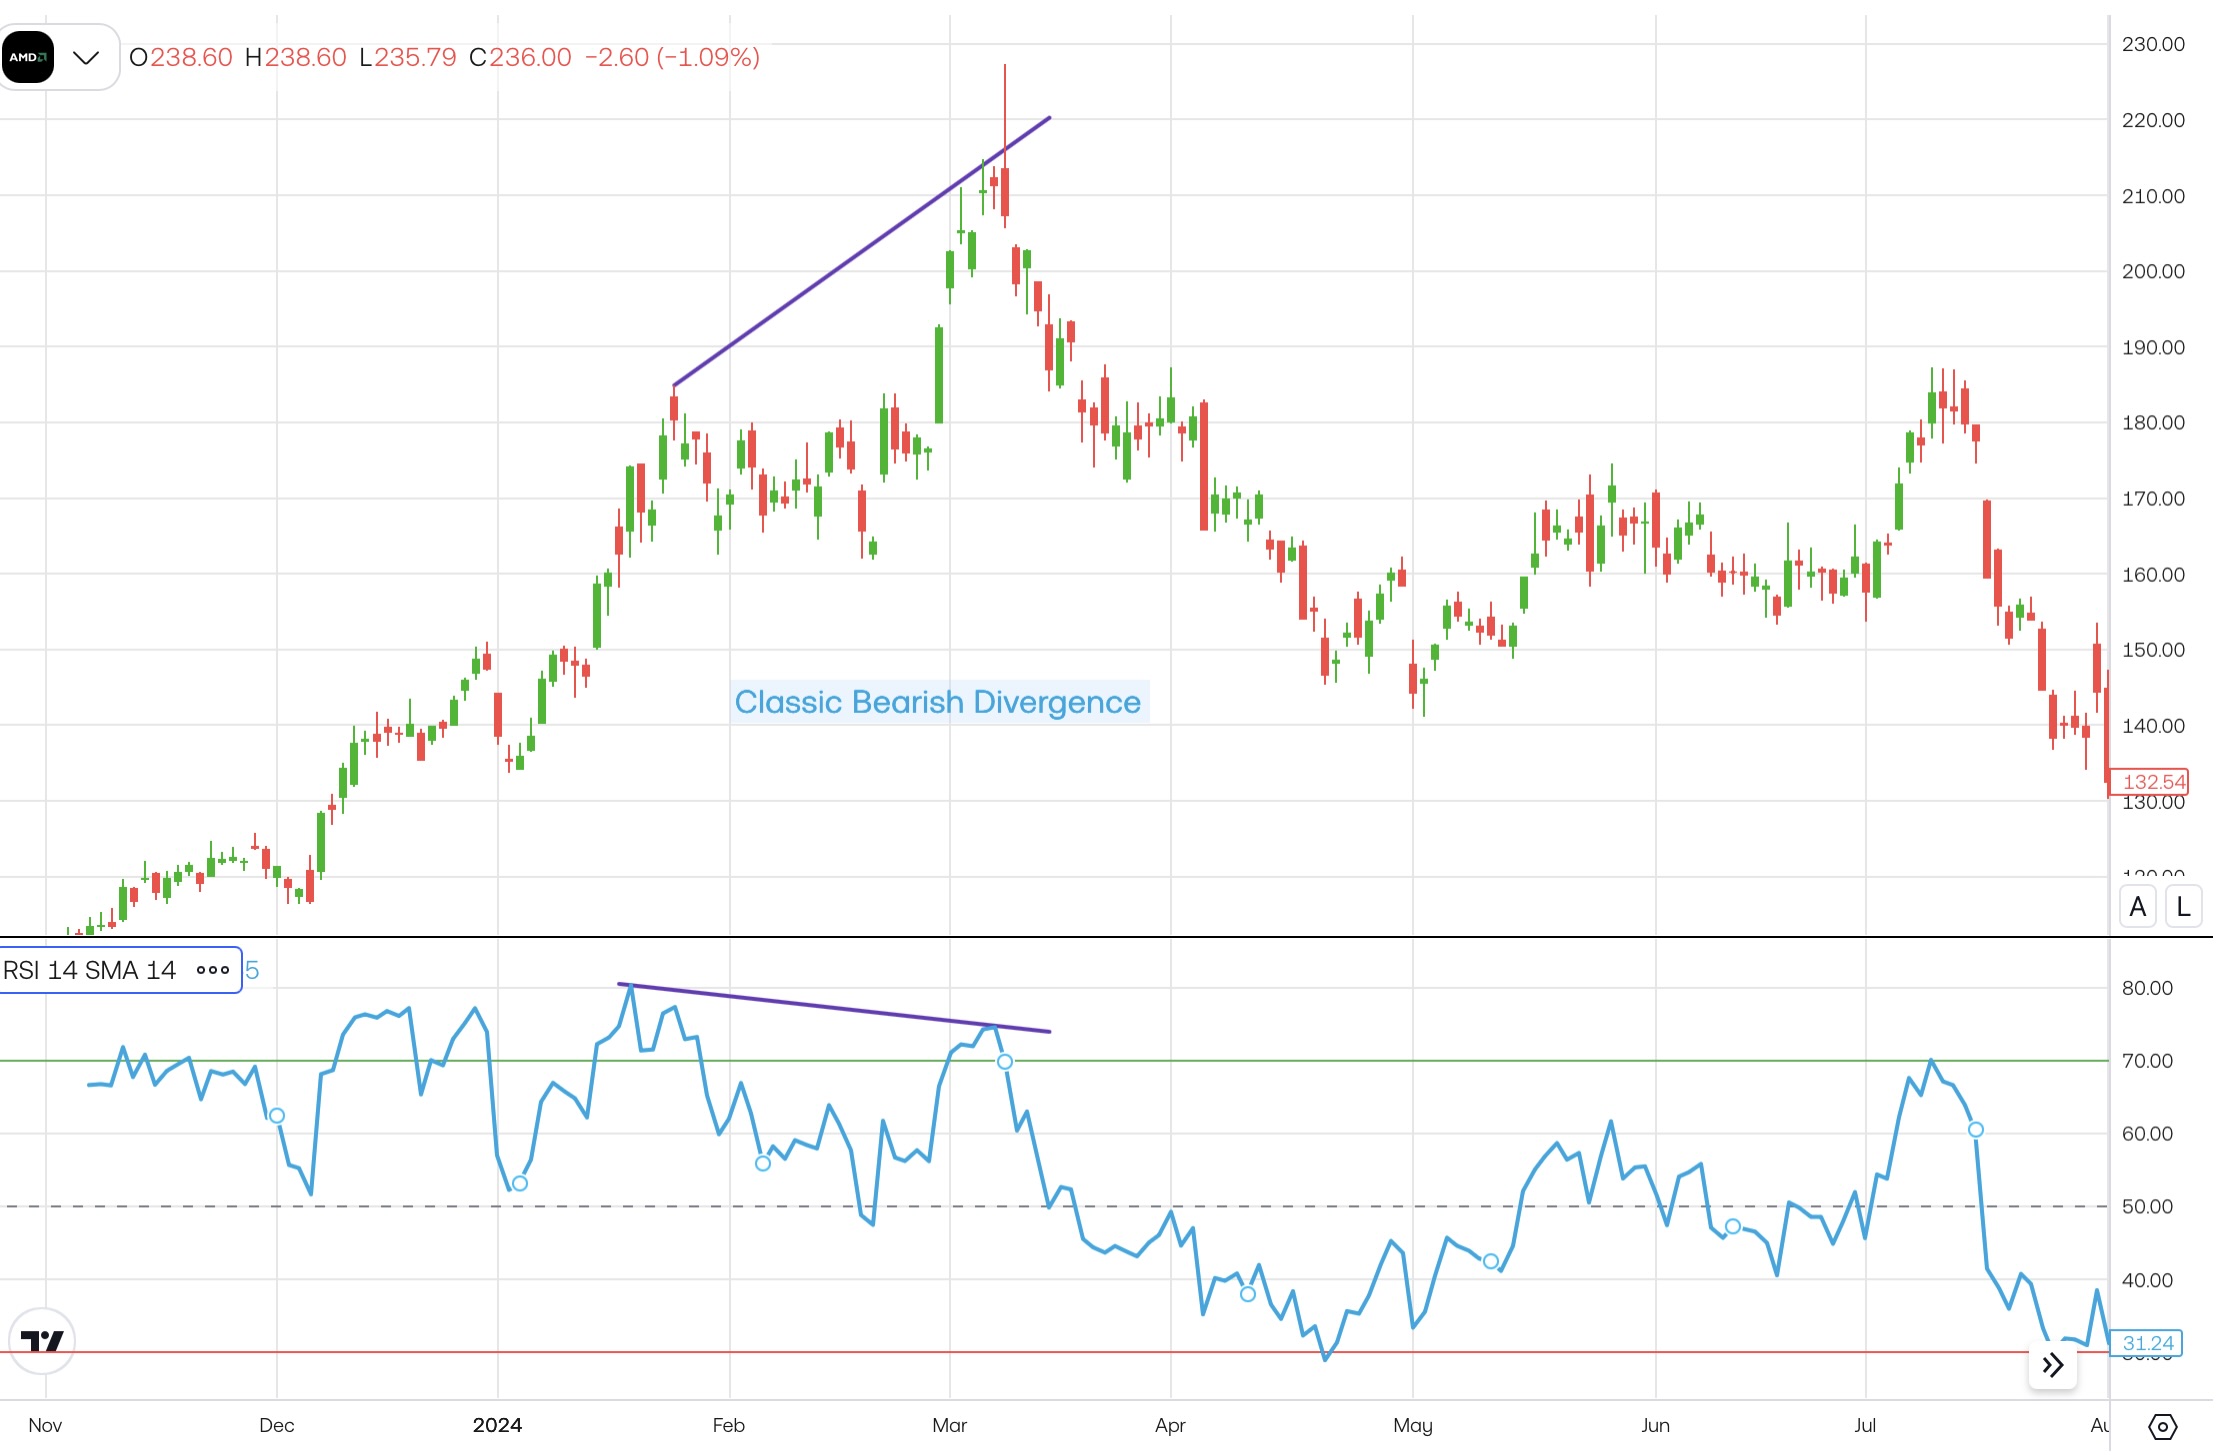
Bearish RSI divergence example
If the price rises to a new high, but RSI peaks at a lower level than it did before — this is known as bearish divergence.
 Source: Trading 212. This example is for illustration purposes only and does not constitute financial advice. Past performance is not indicative of future results.
These patterns can suggest that momentum is weakening, even if price hasn’t yet reacted. It is like an early warning signal that things are about to change.
However, divergence happens frequently and doesn't always result in a reversal. It may simply indicate that a trend is slowing down. Because of this, divergence is usually treated as a cautionary sign rather than a standalone trigger.
However, divergence happens frequently and doesn't always result in a reversal. It may simply indicate that a trend is slowing down. Because of this, divergence is usually treated as a cautionary sign rather than a standalone trigger.
4. RSI positive & negative reversals
Positive and negative RSI reversals are almost like a backwards version of divergence. This understandably creates a little confusion at first glance, which hopefully we can clarify quickly here:
- In a positive reversal, price makes a higher low while RSI makes a lower low. The idea here is that price is proving its strength despite the weak momentum.
- A negative reversal is the opposite – price makes a lower high, but RSI makes a higher high. Here price is showing weakness despite strong momentum.
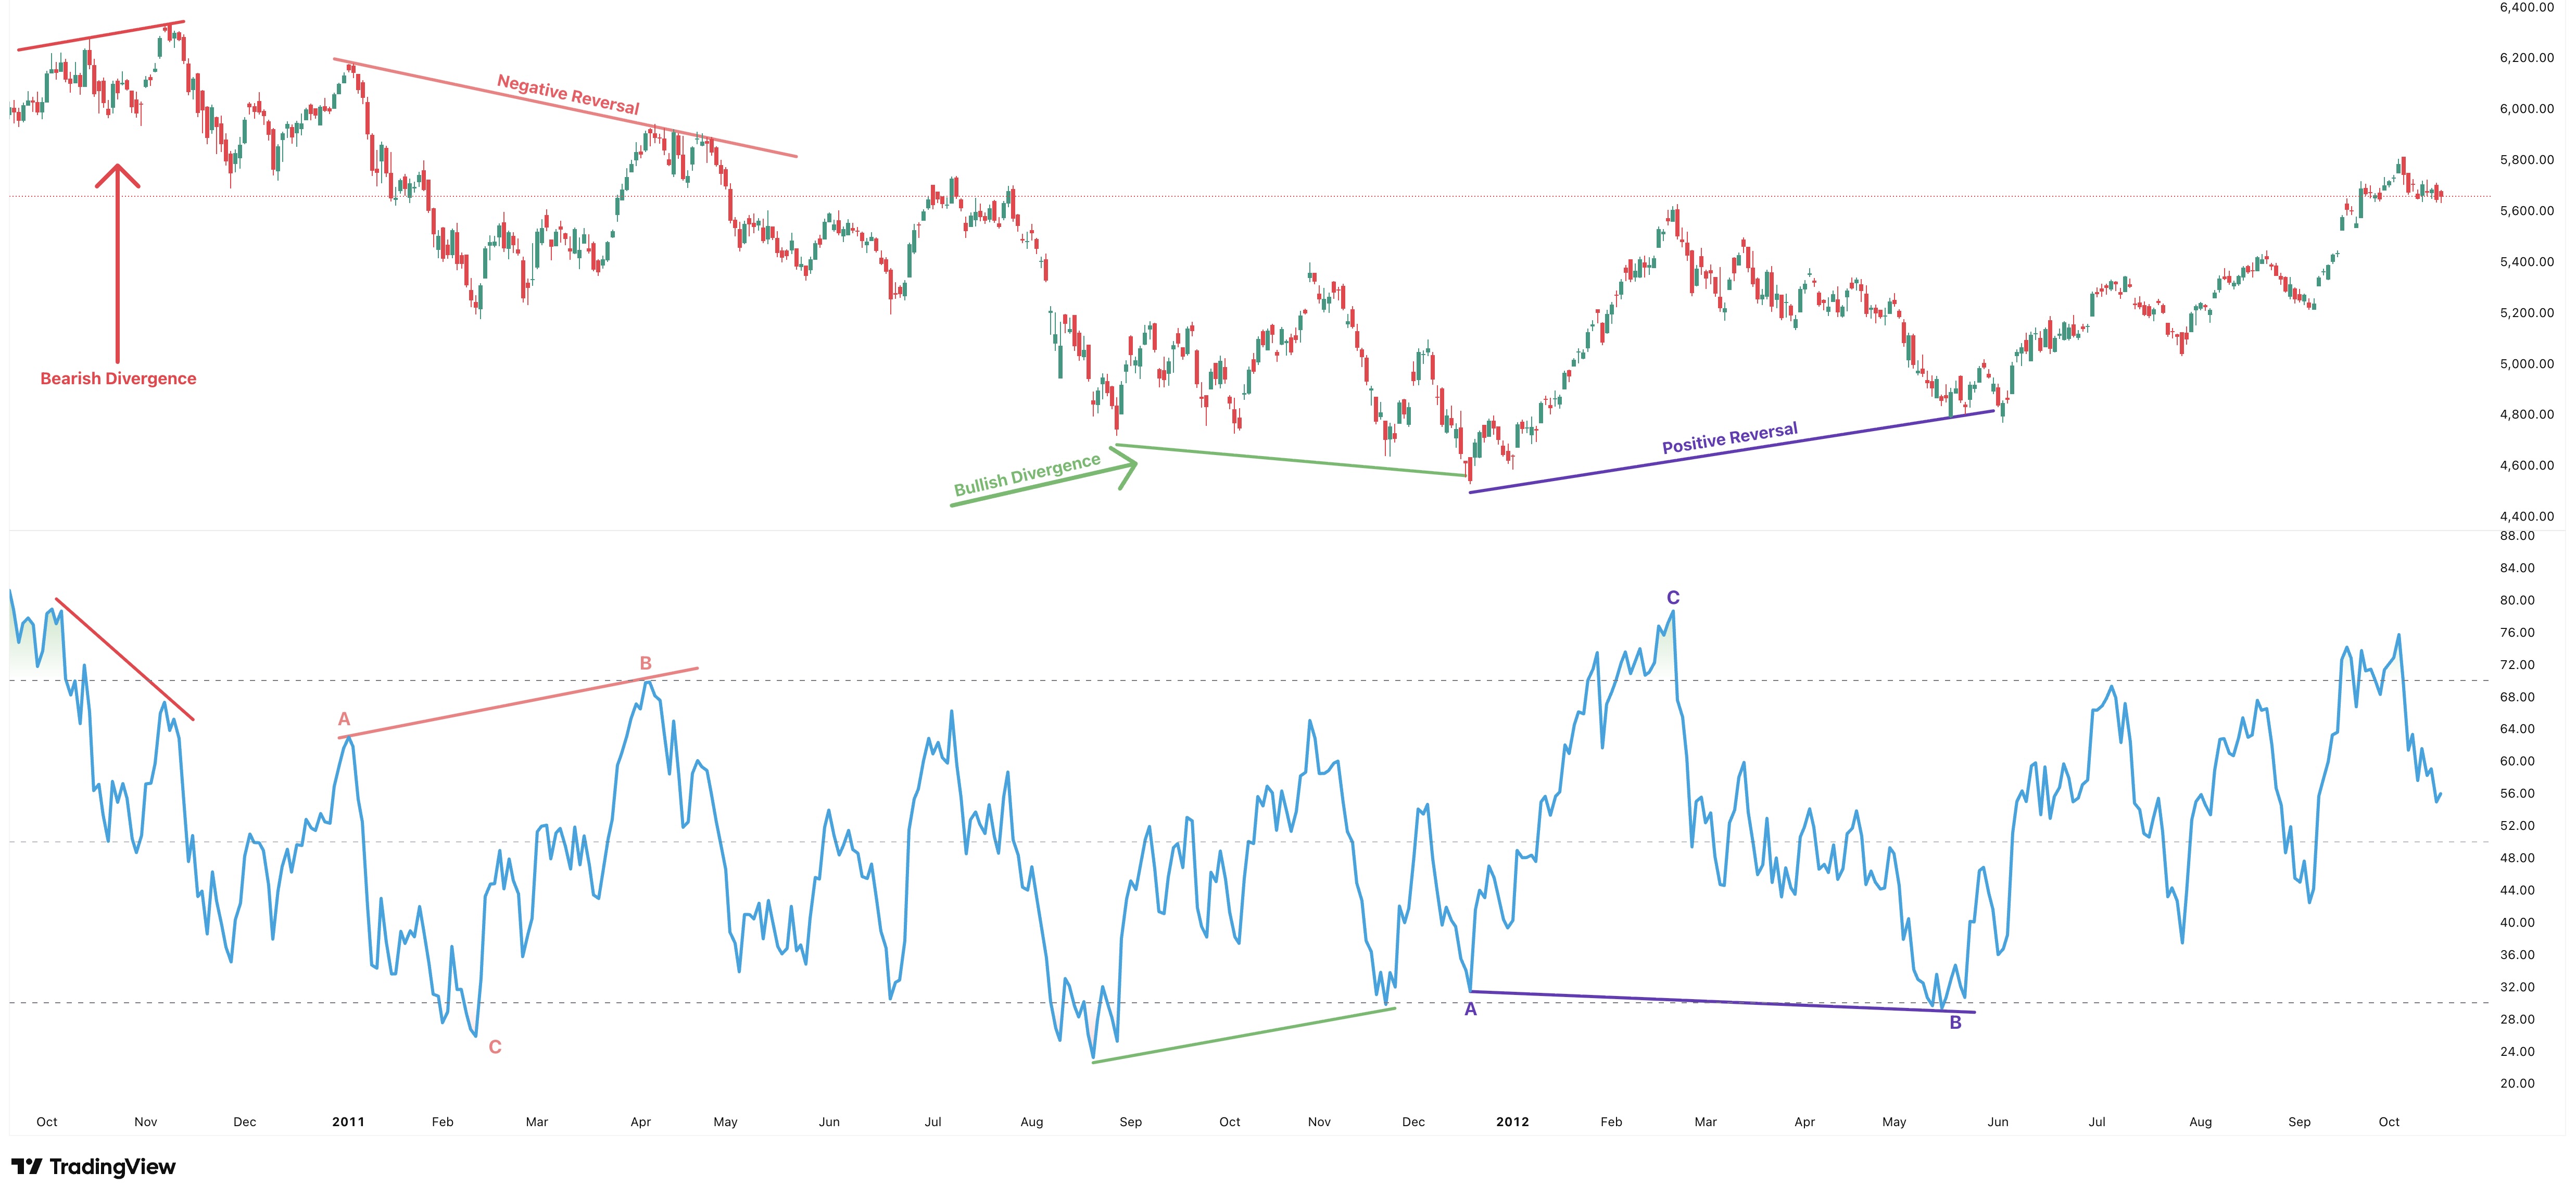 Source: TradingView
These reversals are interpreted as price is trumping its own momentum whereas in divergence, momentum is taken as a signal as to what to expect next in price. Again, they are not guarantees, but they offer another way to analyse the relationship between price and momentum.
5. RSI failure swings
An RSI failure swing is a pattern invented by J. Welles Wilder, the creator of the RSI indicator. It occurs when RSI enters overbought or oversold territory, pulls back, and then changes direction again but the second time fails to reach a new extreme.
Think of it like the two swings that might form a divergence, but on a smaller scale. The main difference with divergence vs failure swings is the focus on the RSI itself rather than divergence with price.
Think of it like the two swings that might form a divergence, but on a smaller scale. The main difference with divergence vs failure swings is the focus on the RSI itself rather than divergence with price.
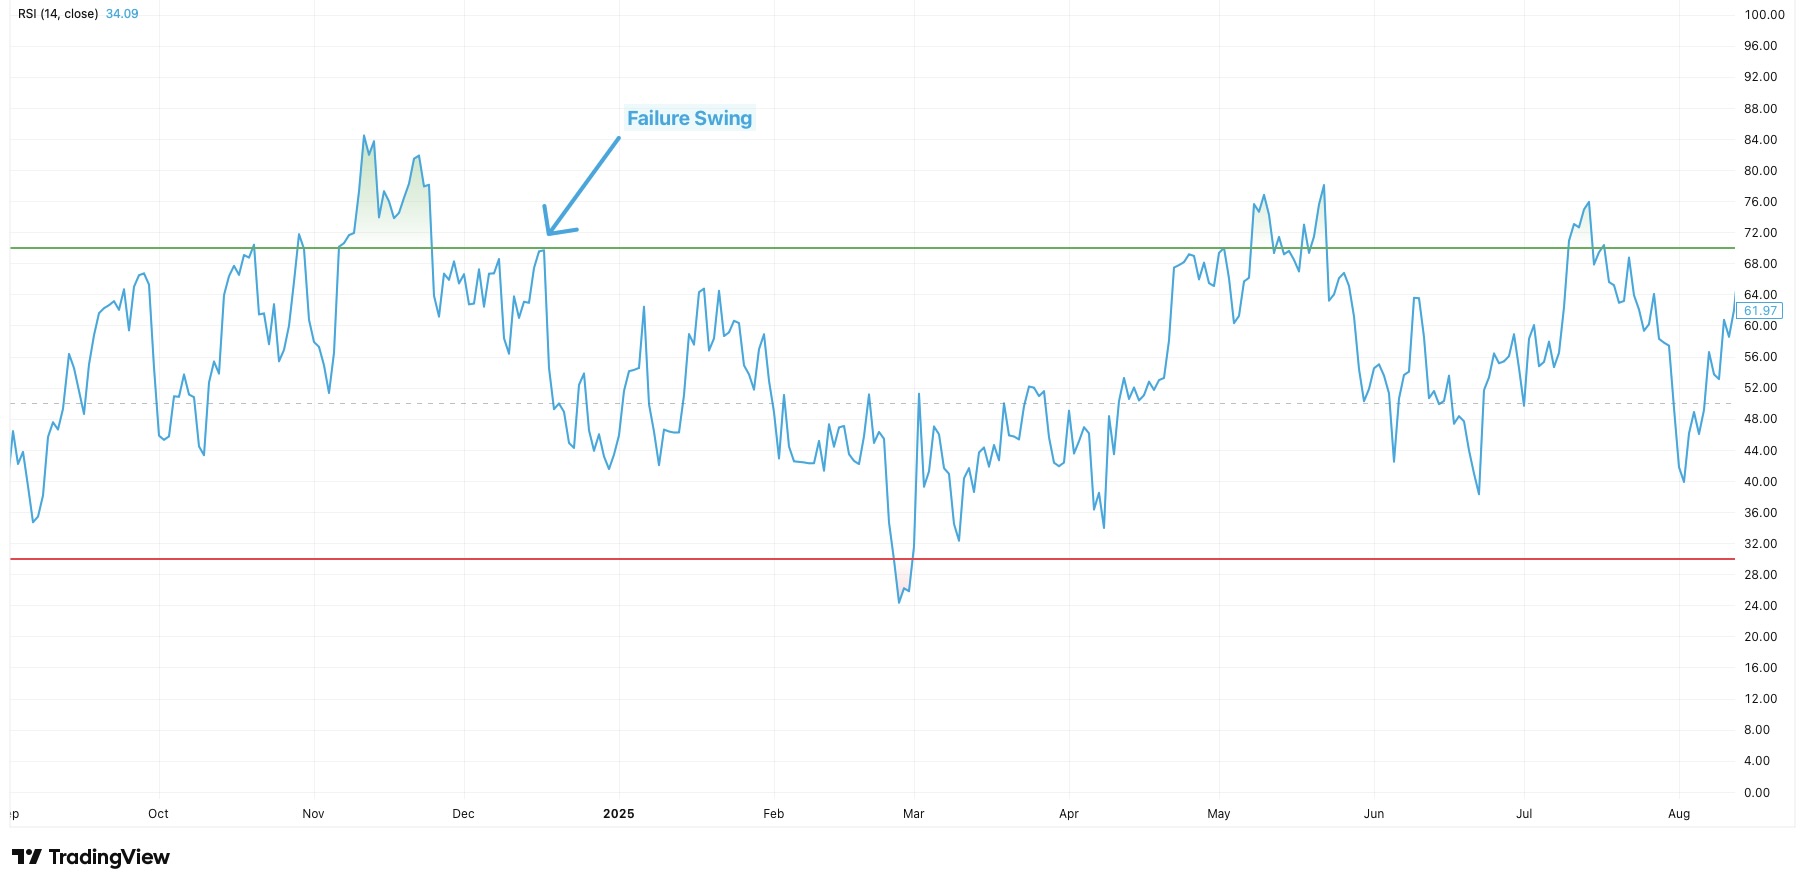 Source: TradingView
Using the RSI indicator in stock trading
An important consideration for using RSI strategies for stock trading is that stock markets tend to go up over time. A possible implication of this bullish tendency in stock markets is that bullish RSI signals might be more reliable than bearish RSI signals.
The impact of RSI on stock market trends
This idea is simplified further if you are a long-only stock trader because naturally you will only be looking for buy signals to enter a trade. However, you might use sell signals to exit an existing position, even if you would not be putting on a short position.
Watch the buy and sell signals that fit trends
A concept that stands the test of time across many markets and many technical indicators is that the signals that follow the general trend perform better.
If, for example, Tesla (TSLA) stock has been in a bull market for 2 years, RSI buy signals following periods of short term weakness will tend to offer better signals than RSI sell signals. In fact, most counter-trend signals will probably fail except the last signal that signals the top or bottom of the market.
If, for example, Tesla (TSLA) stock has been in a bull market for 2 years, RSI buy signals following periods of short term weakness will tend to offer better signals than RSI sell signals. In fact, most counter-trend signals will probably fail except the last signal that signals the top or bottom of the market.
RSI for forex trading insights and important nuances
Currency pairs tend to move in tighter, often more consistent trends, which means RSI signals can stay near the overbought or oversold levels for longer without a clear reversal.
In fast-moving forex markets, RSI is sometimes used with shorter settings like a 9-period or 7-period RSI to increase responsiveness. Another way to account for strong trends is to use 75 or 80 as what you deem overbought instead of the default 70. Likewise 25 or 20 can be used instead of the default 30 level for oversold.
In fast-moving forex markets, RSI is sometimes used with shorter settings like a 9-period or 7-period RSI to increase responsiveness. Another way to account for strong trends is to use 75 or 80 as what you deem overbought instead of the default 70. Likewise 25 or 20 can be used instead of the default 30 level for oversold.
What is a good RSI value for trading?
You probably already know that there is no good RSI value – different values can be useful or not depending on your trading strategy. Let’s look at the two main ones below:
1. The role of RSI in identifying market momentum for trend following
Momentum strategies seek to buy strength and sell later at even more strength. Or alternatively sell weakness and buy back later at even weaker levels. By this virtue, a good RSI value for a possible trade setup is an overbought reading for buying and an oversold level for going short.
2. The accuracy of the RSI indicator for reversion to the mean strategies
The alternative to momentum is reversion to the mean, which means buying weakness and selling strength. For this strategy, oversold levels are better for buying and overbought levels are more useful for selling.
How to use RSI in combination with other indicators
As mentioned at the start, RSI numbers by themselves have little use. But even after interpreting the number through the lens of the different RSI trading strategies, the signals can’t work in isolation.
An RSI buy or sell signal will be stronger if other momentums confirm the signal.
An RSI buy or sell signal will be stronger if other momentums confirm the signal.
- RSI and Moving Averages: Traders may look for RSI signals that align with price trading above or below a moving average (such as the 50-day or 200-day) to confirm trend direction.
- RSI and MACD: A bullish RSI reading backed by a MACD crossover may be seen as a stronger signal than either alone.
- RSI and Support/Resistance: RSI reaching overbought or oversold levels near major price support or resistance can help contextualise whether a market is stretched or showing strength.
- RSI and Fibonacci Retracements: If RSI shows oversold conditions near a key Fibonacci level, some interpret this as possible support from both price structure and momentum.
- RSI and Volume Indicators: Rising RSI combined with increasing volume can add conviction to signs of strength, while declining volume may temper expectations.
- RSI and Trend Lines or Chart Patterns: RSI failure swings or divergences that occur in conjunction with breakouts from trend lines or price patterns (like triangles or flags) are often considered more meaningful.
How do traders choose RSI settings for different strategies?
While many choose to keep RSI at its default 14 periods, others choose to alter the settings to suit their trading strategy. The main effect of changing the periods is to adjust how sensitive the RSI becomes to price movements.
A shorter period, such as 7 or even 5, makes RSI respond more quickly to recent price changes, which some traders prefer for short-term or intraday setups.
A longer period like 21 or 28 smooths out the RSI line, reducing noise and making it more suited to identifying broader trends.
The choice often depends on the timeframe being traded and the trader’s approach. For example, someone trading hourly charts might want a more responsive RSI, while a trader using daily or weekly charts may prefer less volatility in the reading.
The importance of RSI in technical analysis
You can be a fully proficient technical analyst and completely ignore RSI if you prefer. RSI is not essential but it is widely used because it offers a simple and visual way to assess recent price momentum. Its strength lies in how it can highlight potential shifts in sentiment, especially when price alone does not tell the full story.
Some traders use RSI to help confirm trends, spot signs of exhaustion, or support other signals already present in the chart. And some do not use it at all.
Some traders use RSI to help confirm trends, spot signs of exhaustion, or support other signals already present in the chart. And some do not use it at all.
Recap
The Relative Strength Index (RSI) is a widely used momentum indicator that helps traders assess the strength of recent price movements. It doesn't predict market direction but can offer useful context particularly when combined with other indicators.
Whether it is spotting possible overbought or oversold conditions, identifying divergences, or refining entry and exit points within a strategy, RSI has become a common part of many traders’ technical analysis approach. Like any indicator, it is most effective when used thoughtfully and not relied on in isolation.
Whether it is spotting possible overbought or oversold conditions, identifying divergences, or refining entry and exit points within a strategy, RSI has become a common part of many traders’ technical analysis approach. Like any indicator, it is most effective when used thoughtfully and not relied on in isolation.
FAQ
Q: What is the difference between RSI and Moving Average Convergence Divergence (MACD)?
RSI measures the speed and change of recent price moves on a fixed scale, while MACD tracks the relationship between two moving averages and is often used to spot trend direction and momentum shifts.
Q: What is the difference between RSI divergence and RSI reversal?
RSI divergence compares price direction with the RSI line to spot momentum imbalances, whereas a reversal refers to a full change in trend direction, which may or may not be confirmed by divergence.
Q: What do different RSI levels indicate in market analysis?
Levels near 70 suggest strong buying pressure or overbought conditions, while levels near 30 may indicate selling pressure or potential oversold areas — values between 40 and 60 often appear during consolidation.
Q: What is RSI 14 relative strength index?
RSI 14 refers to the standard 14-period setting introduced by J. Welles Wilder, which calculates the relative strength over 14 data points, commonly used in daily chart analysis.
Q: How do you calculate the RSI?
RSI is calculated using the average gains and average losses over a set period, typically 14, and then applying the formula: RSI = 100 – (100 ÷ (1 + RS)).
Q: Is relative strength the same as RSI?
No, it is different. RSI is a specific oscillator, while relative strength can also refer to how one asset performs compared to another i.e. like stock A versus the S&P 500.
Q: How does RSI compare to other technical indicators?
RSI is a momentum oscillator, while others like Bollinger Bands or Fibonacci retracements focus on volatility or potential price levels, making each tool suitable for different types of analysis.
Q: What if RSI is between 30 and 70?
This range is considered neutral territory; RSI between 40 and 60 often reflects consolidation or sideways movement, rather than a clear trend.
Q: How can RSI settings be adjusted for different trading styles?
Short-term traders may use RSI 7 or 9 for faster signals, while swing or position traders often stick with RSI 14 or lengthen it to reduce noise.
Q: How to use RSI correctly?
Many traders use RSI alongside trendlines, chart patterns, or moving averages to confirm price behaviour, rather than relying on the RSI value alone.