What is MACD (Moving Average Convergence Divergence) and how to use it in CFD trading?
You have probably seen MACD on charts before but have you ever stopped to ask what it is really telling you? Most traders haven't, and the answer is surprisingly simple and actionable.
Moving Average Convergence Divergence (MACD) uses Еxponential Moving Average (ЕМА) to show momentum and trend direction. That means you can spot potential shifts earlier than relying on price alone. This gives you another layer of insight when analysing a CFD trade you want to take.
Moving Average Convergence Divergence (MACD) uses Еxponential Moving Average (ЕМА) to show momentum and trend direction. That means you can spot potential shifts earlier than relying on price alone. This gives you another layer of insight when analysing a CFD trade you want to take.
QUOTE
Some of the best trades come when everyone gets very panicky. The crowd can often act very stupidly in the markets. As a short-term trader, I try to wait until the rubber band is stretched to its extreme point.
– Linda Bradford Raschke (American financier)
– Linda Bradford Raschke (American financier)
Big ideas
- MACD uses the difference between two EMAs (typically 12-day and 26-day EMAs) to track momentum and highlight shifts in trend strength.
- A MACD crossover occurs when the MACD line moves above or below its signal line, which some traders interpret as a potential turning point in price movement.
- Divergence between MACD and price (when one moves higher while the other moves lower) is often seen as a possible early warning of a weakening trend.
- Quite uniquely, despite being a trend-following tool, MACD can also provide insight into the strength or weakness of price moves through the histogram, which shows how far apart the MACD and signal lines are at any given moment.
What Is MACD (Moving Average Convergence Divergence)?
DEFINITION
The MACD, or Moving Average Convergence Divergence, is a technical indicator that some traders use to analyse price momentum and potential trend shifts.
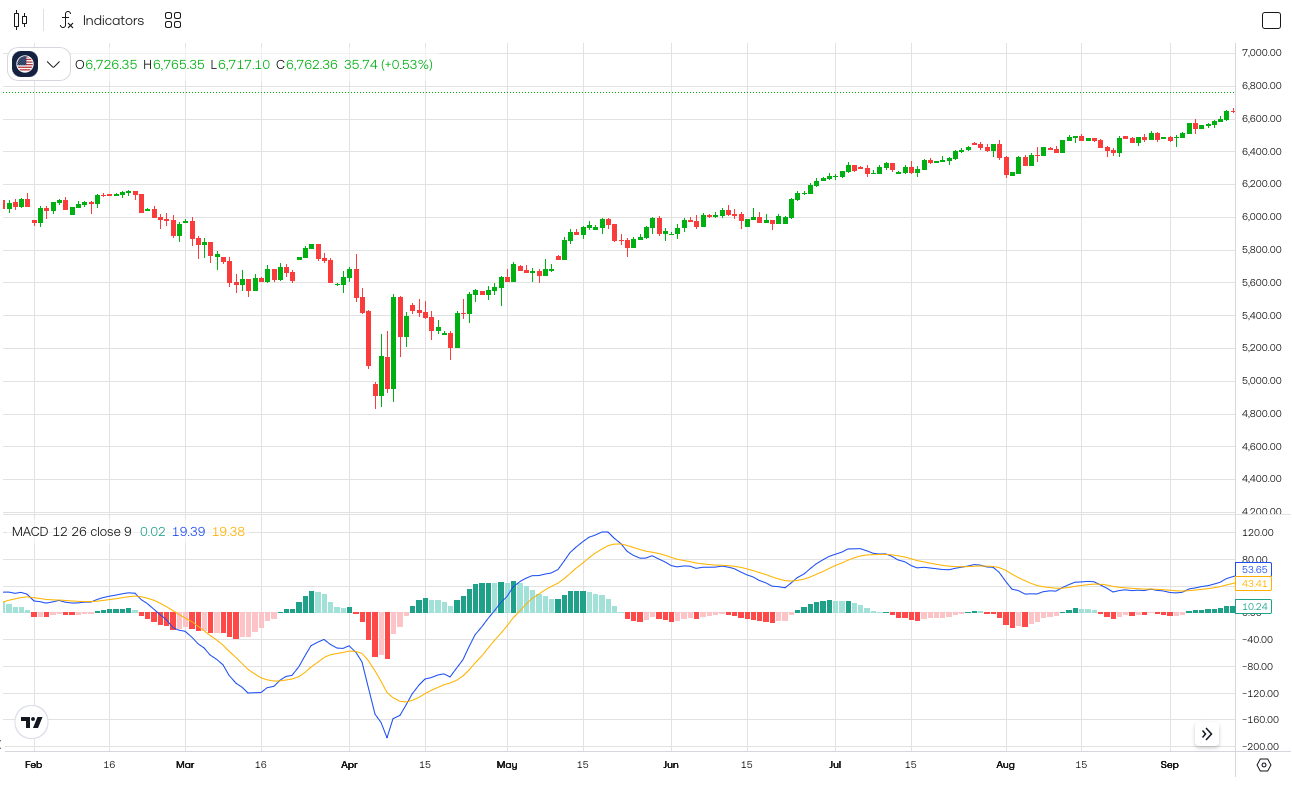 Source: Trading 212 app. This example is for illustration purposes only and does not constitute financial advice. Past performance is not indicative of future results.
Here is the same thing flipped into portrait mode:
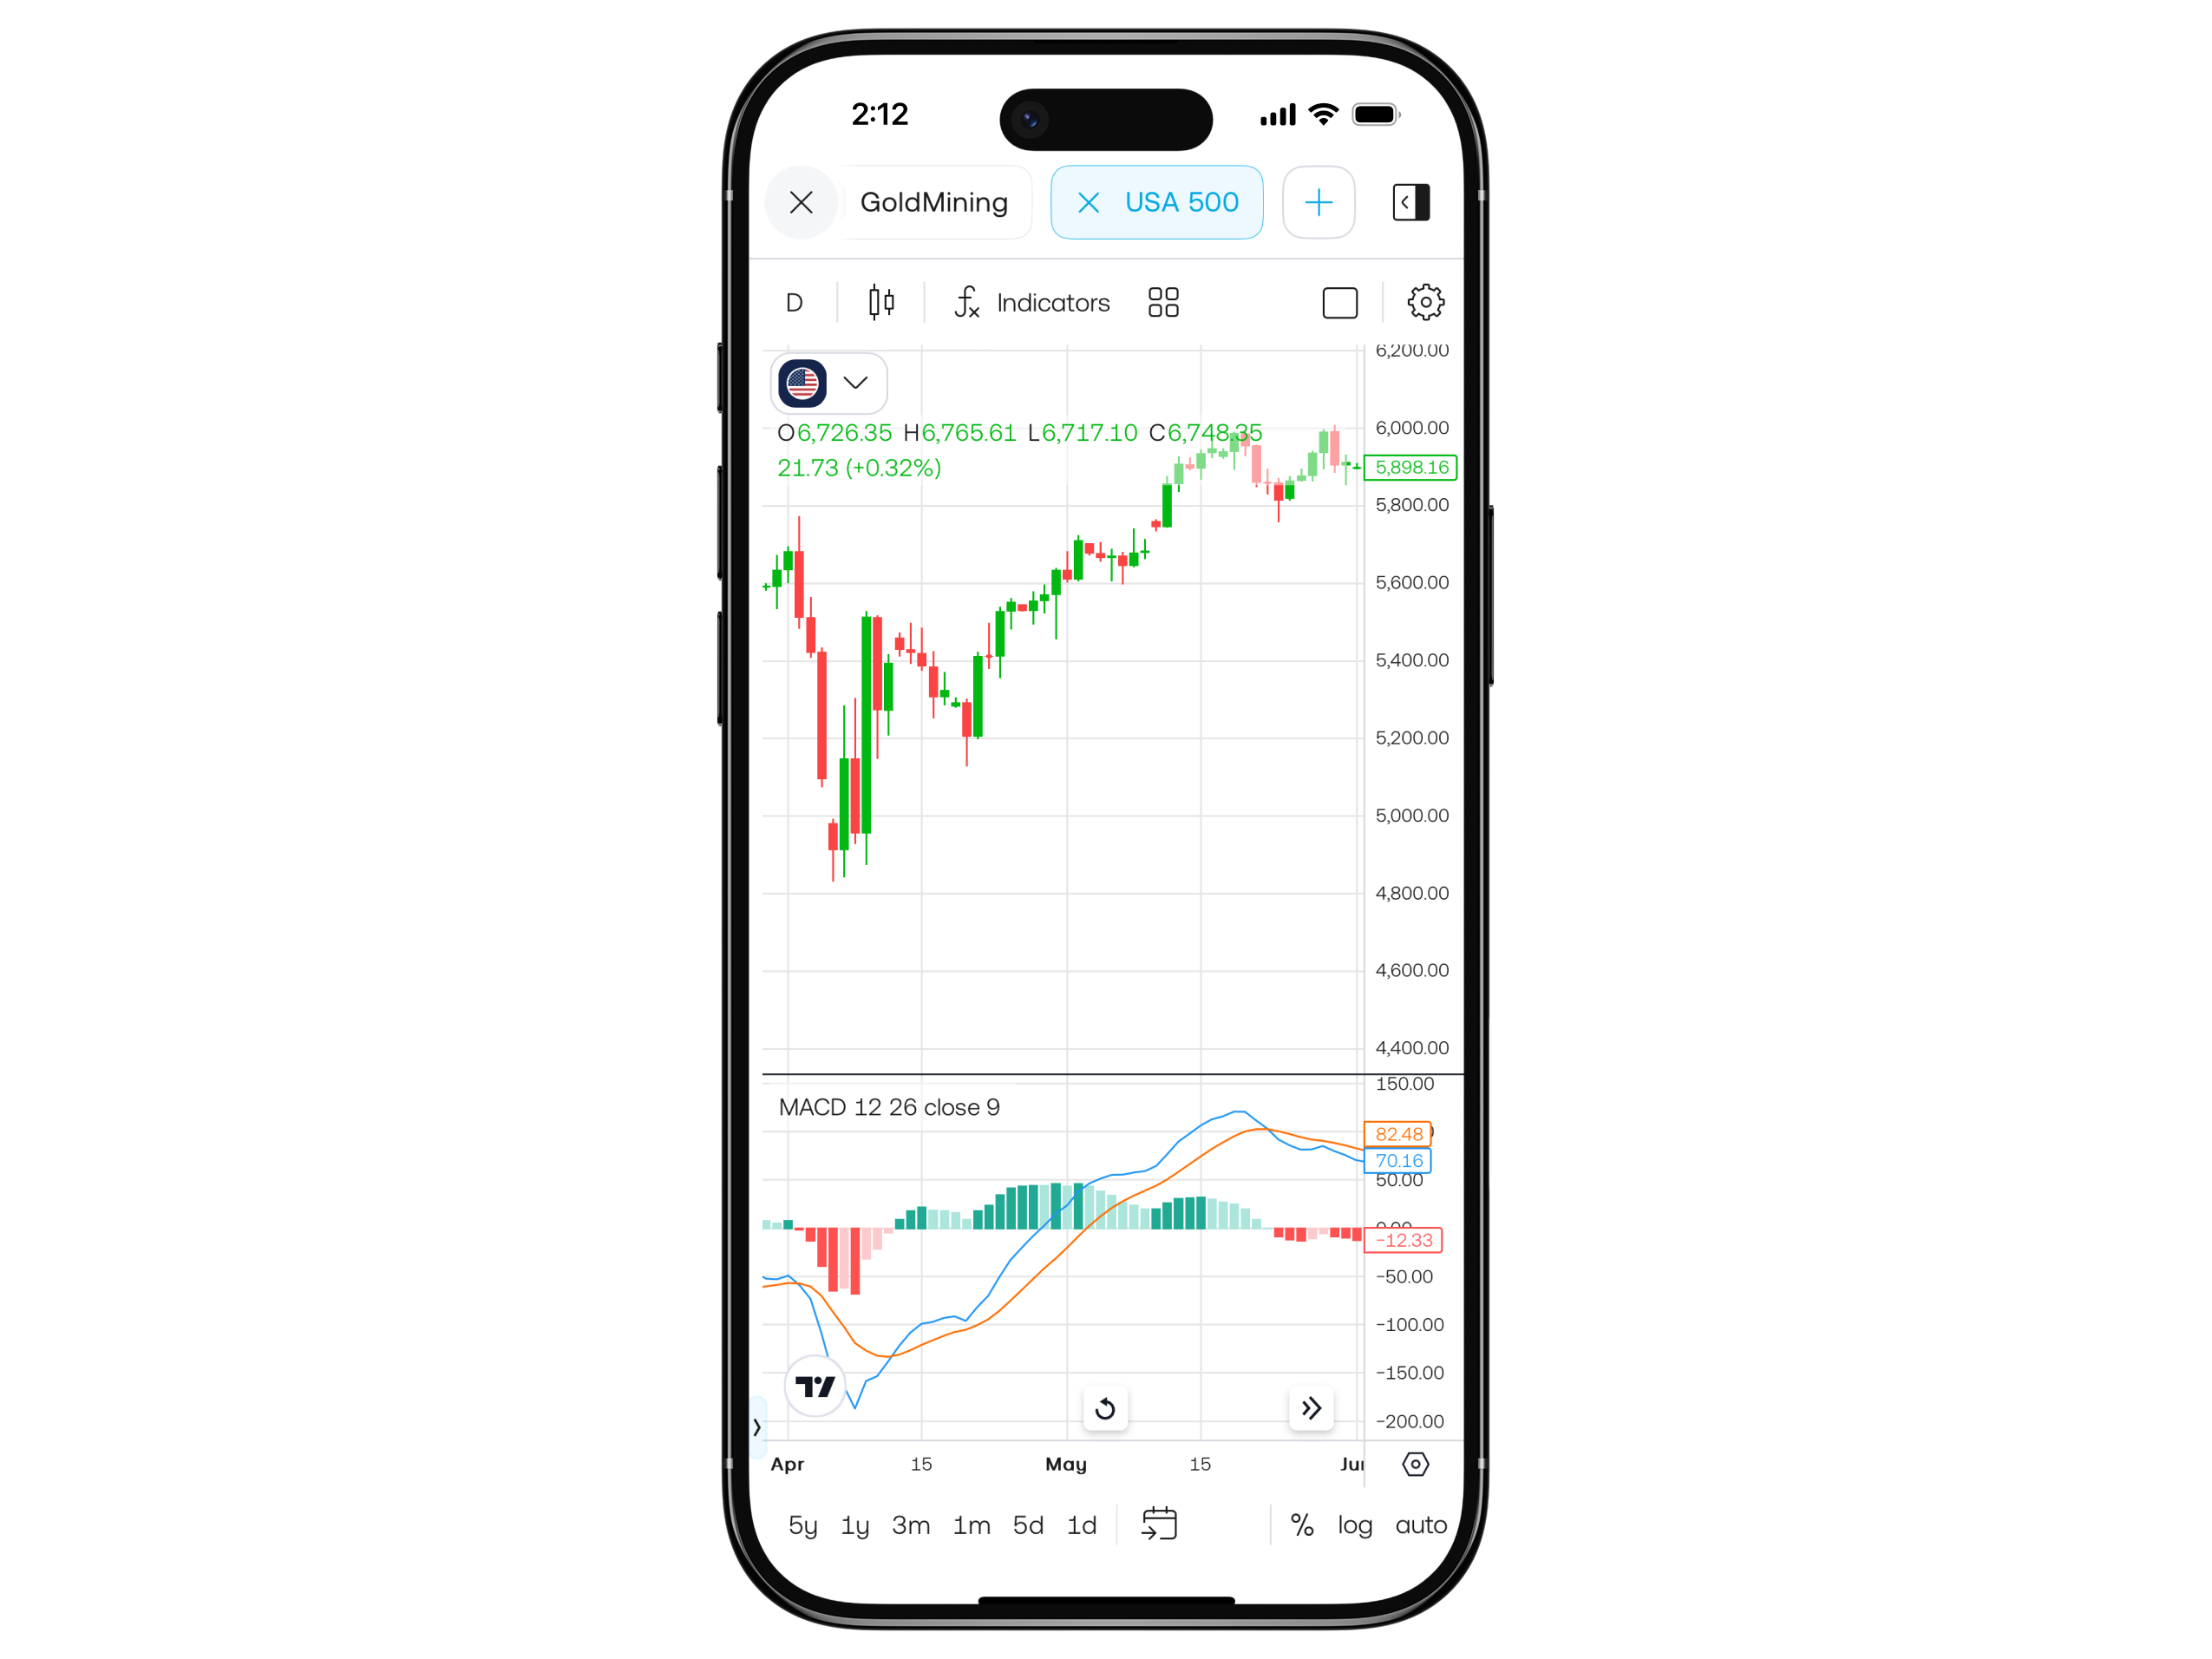 Source: Source: Source: Trading 212 app. This example is for illustration purposes only and does not constitute financial advice. Past performance is not indicative of future results.
How does MACD work?
It is plotted underneath price charts to reflect the relationship between two averages of price over time. The MACD is not trying to point out exact highs or lows. Instead, it reflects whether momentum may be building or weakening.
You as a trader can use the way the lines in the MACD indicator move in relation to each other, and to the zero line to decipher the market environment and potentially to find buy and sell signals.
Plenty of charting platforms display MACD automatically so there is no need to calculate it manually. But understanding what the indicator is showing can help make sense of what is happening on the chart, especially when looking at price trends and how they are evolving.
What does the MACD indicator measure?
At its core, MACD shows the difference between two EMAs – one calculated over a shorter period (commonly 12 days), and another over a longer period (commonly 26 days).
Here we have already answered a common question – Does MACD use EMA or SMA (Simple Moving Average)? The answer is EMA.
The result of subtracting the longer EMA from the shorter one creates the MACD line. A second line, called the signal line, is then plotted on top of this using a 9-day EMA of the MACD line itself. The difference between the MACD line and the signal line is shown as a histogram, which fluctuates above and below a zero line.
What do traders often choose as MACD settings?
The standard MACD settings you will come across on most charting platforms are 12, 26, and 9. These are the parameters of MACD that most traders stick with. There is a similar logic to the one mentioned in our RSI (Relative Strength Index) guide in that traders assume a self-fulfilling prophecy around using the standard settings for a technical indicator.
These numbers represent the number of periods used to calculate the two exponential moving averages (12 and 26), and the signal line (9). They were originally applied to daily charts, so 12 would be the past 12 trading days, and so on.
Either through an assumption that they are optimal, a belief in a self-reinforcing property or perhaps laziness, the default MACD values are still widely used today, but they are not fixed.
Some traders choose to adjust the settings depending on their timeframes or how sensitive they want the indicator to be. Shortening the EMAs (e.g. using 5 and 35) may make the MACD respond more quickly to price changes. On the other hand, lengthening the settings might smooth out more noise.
How to calculate MACD with formula and examples
The three components of MACD each have their own formula, which when put together offer an intuitive way to interpret trend and momentum.
FORMULA
• MACD line = 12-period EMA – 26-period EMA
• Signal line = 9-period EMA of the MACD line
• MACD histogram = MACD line – Signal line
• Signal line = 9-period EMA of the MACD line
• MACD histogram = MACD line – Signal line
EXAMPLE
Suppose a stock’s 12-period EMA is 150 and the 26-period EMA is 145.
MACD line = 150 – 145 = 5
Now, if the 9-period EMA of the MACD line is 4, the Signal line is 4
MACD histogram = 5 – 4 = 1
MACD line = 150 – 145 = 5
Now, if the 9-period EMA of the MACD line is 4, the Signal line is 4
MACD histogram = 5 – 4 = 1
In practice, most CFD platforms handle these calculations in real time.
How to use the MACD indicator: Beginner trading strategies
In CFD trading and technical analysis more broadly, MACD indicators are often used to spot potential changes in momentum or trend strength. Before we move onto advanced MACD trading strategies, the most common elements traders pay attention to are the following beginner strategies:
- MACD vs signal line crossovers
- Histogram direction
- MACD line vs the zero line
What are MACD crossovers?
A typical approach involves watching for a MACD crossover — where the MACD line crosses above or below the signal line. Some traders see this as a possible sign that momentum is shifting.
KEY IDEA 1
If the MACD line crosses above the signal line, it may be interpreted as bullish momentum increasing. If it crosses below, it may be seen as momentum weakening.
Note: You will see that when the MACD line crosses above or below the signal line, this corresponds with the MACD histogram crossing above or below the zero line.
How to use the MACD histogram
The histogram provides a visual cue for how strong that difference is.
KEY IDEA 2
When bars are growing in height, it reflects a widening gap between the MACD and signal lines i.e. momentum is building. When the bars shrink, it may suggest that momentum is fading.
MACD vs the zero line for trend following
It is also common to note whether the MACD line is above or below the zero line.
KEY IDEA 3
Generally, if the MACD is above zero, the trend is established as bullish, while if the MACD line is below zero, the trend is established as bearish.
The issue here is that MACD is a lagging indicator of the trend so it won't pick the start of the trend and could even cross the zero line close to the end of the trend.
It is worth repeating that MACD is not predictive. It doesn’t show certainty, just signals that some traders use to support their analysis alongside other tools.
It is worth repeating that MACD is not predictive. It doesn’t show certainty, just signals that some traders use to support their analysis alongside other tools.
How to use the MACD indicator: Advanced trading strategies
Once you are comfortable with the basic strategies for MACD, you can move onto some more advanced techniques, as follows:
- MACD divergence
- Histogram reversal patterns
- Histogram continuation patterns
What is MACD divergence? (With examples)
MACD divergence happens when the direction of price movement and the MACD indicator start to move out of sync. In other words, the price might be rising while the MACD is falling or vice versa.
Some traders use divergence as a possible early warning that the current trend is weakening, especially when it appears after a strong price move.
Some traders use divergence as a possible early warning that the current trend is weakening, especially when it appears after a strong price move.
KEY IDEA 4
There are two types of divergence:
• Bullish divergence: This occurs when the price makes a lower low, but the MACD forms a higher low. Traders may see this as a potential sign that selling pressure is easing.
• Bearish divergence: This is when the price reaches a new high, but the MACD makes a lower high. It is often taken as a possible sign that upward momentum is slowing.
Bullish divergence example: A forex pair (NZD/USD) is falling – making lower lows, but the MACD starts rising – making higher lows.
Bearish divergence example: NZD/USD is rising steadily and making higher highs, but the MACD line is dropping – making lower highs.
Bearish divergence example: NZD/USD is rising steadily and making higher highs, but the MACD line is dropping – making lower highs.
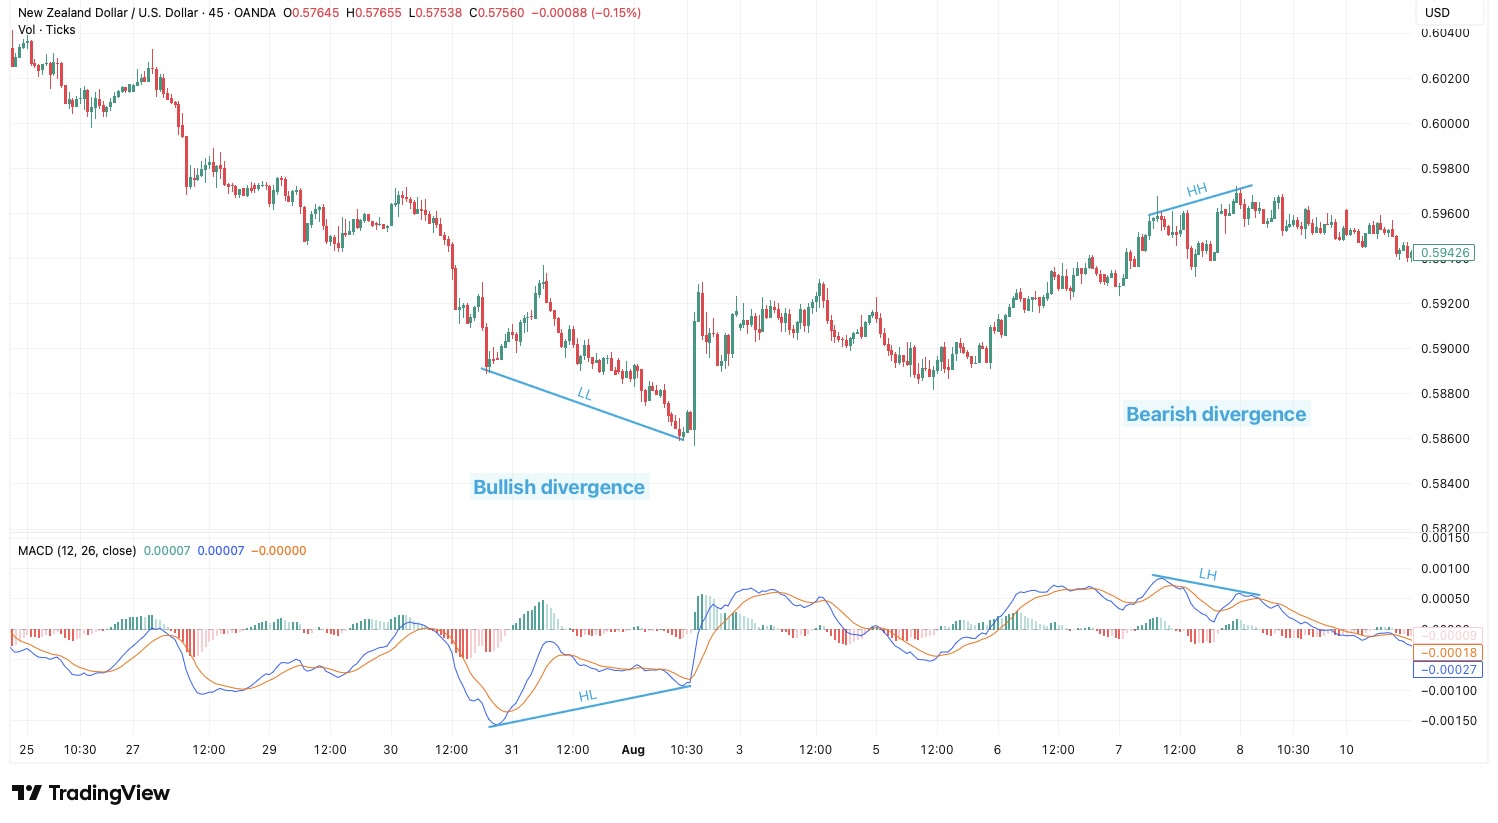 Source: TradingView. This example is for illustration purposes only and does not constitute financial advice. Past performance is not indicative of future results.
MACD histogram reversal patterns
Some traders use the MACD histogram to watch for momentum reversals that might support a change in price direction. They look at the shape and structure of the histogram for clues, particularly when patterns like double tops or head and shoulders begin to emerge.
These patterns don’t form on the price chart itself, but on the histogram, showing how momentum may be behaving differently than price.
These patterns don’t form on the price chart itself, but on the histogram, showing how momentum may be behaving differently than price.
- Double tops in the histogram can suggest that bullish momentum tried to increase a second time but couldn’t exceed the previous peak. Vice versa for MACD double bottom patterns.
- Head and shoulders shape can appear when momentum builds, then eases, then builds again slightly before dropping — echoing the classic price pattern but appearing only in the histogram bars.
 Source: TradingView. This example is for illustration purposes only and does not constitute financial advice. Past performance is not indicative of future results.
KEY IDEA 5
Histogram-based reversal patterns suggest a possible weakening of trend momentum, even if price continues in the same direction for a short while.
These can be used by traders as additional context, particularly after extended moves or near resistance and support levels on the main chart.
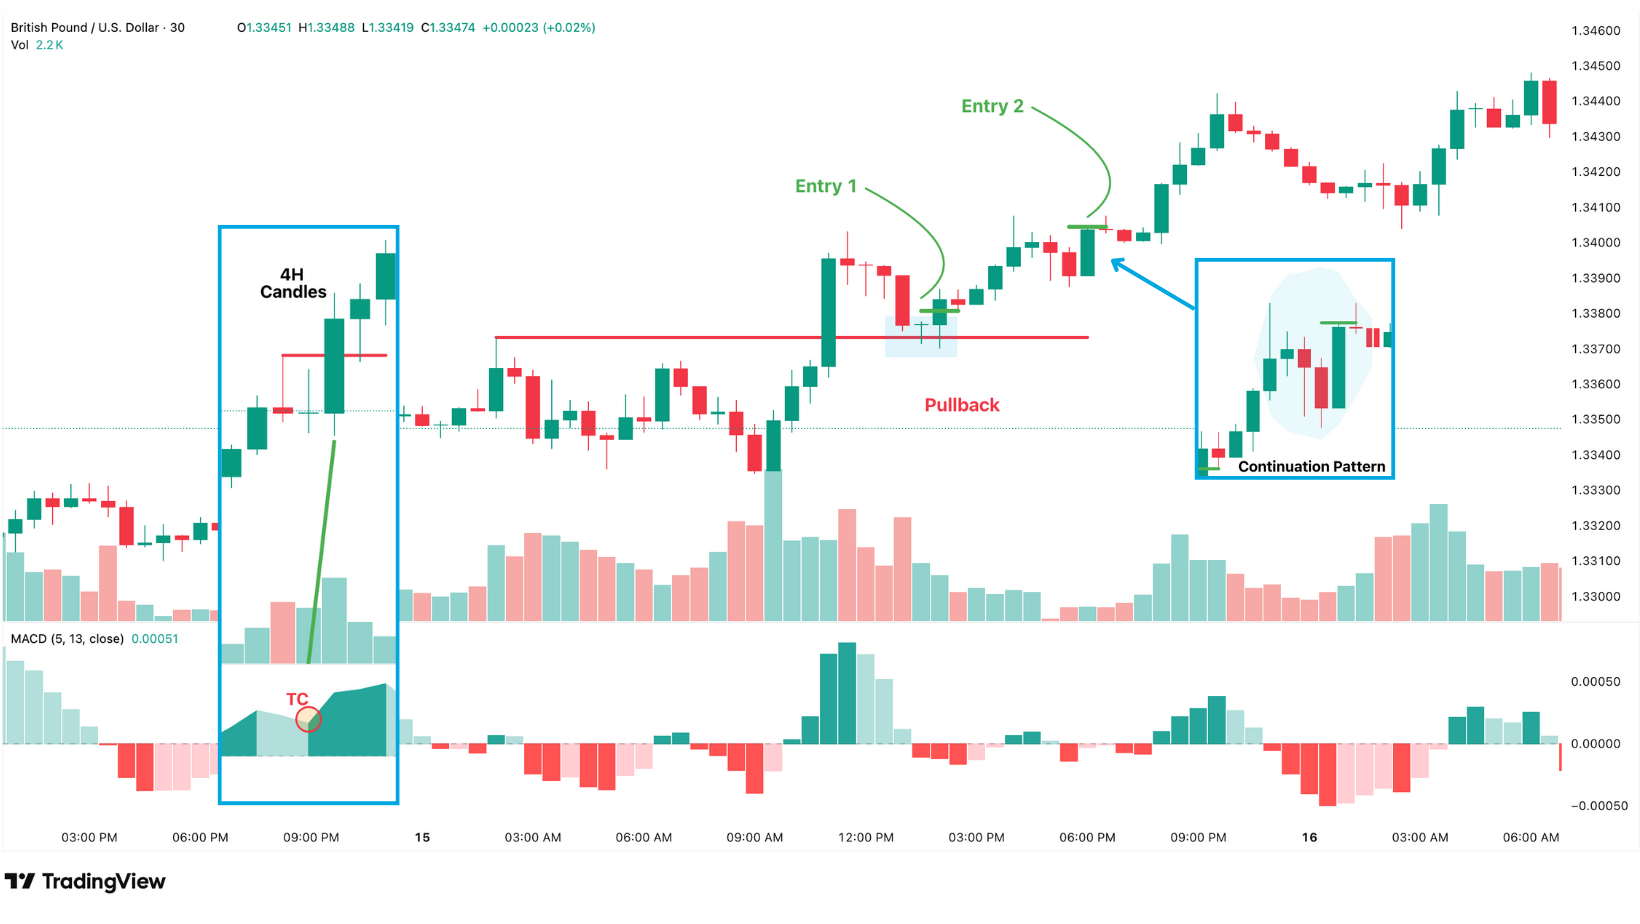
MACD histogram trend continuation patterns
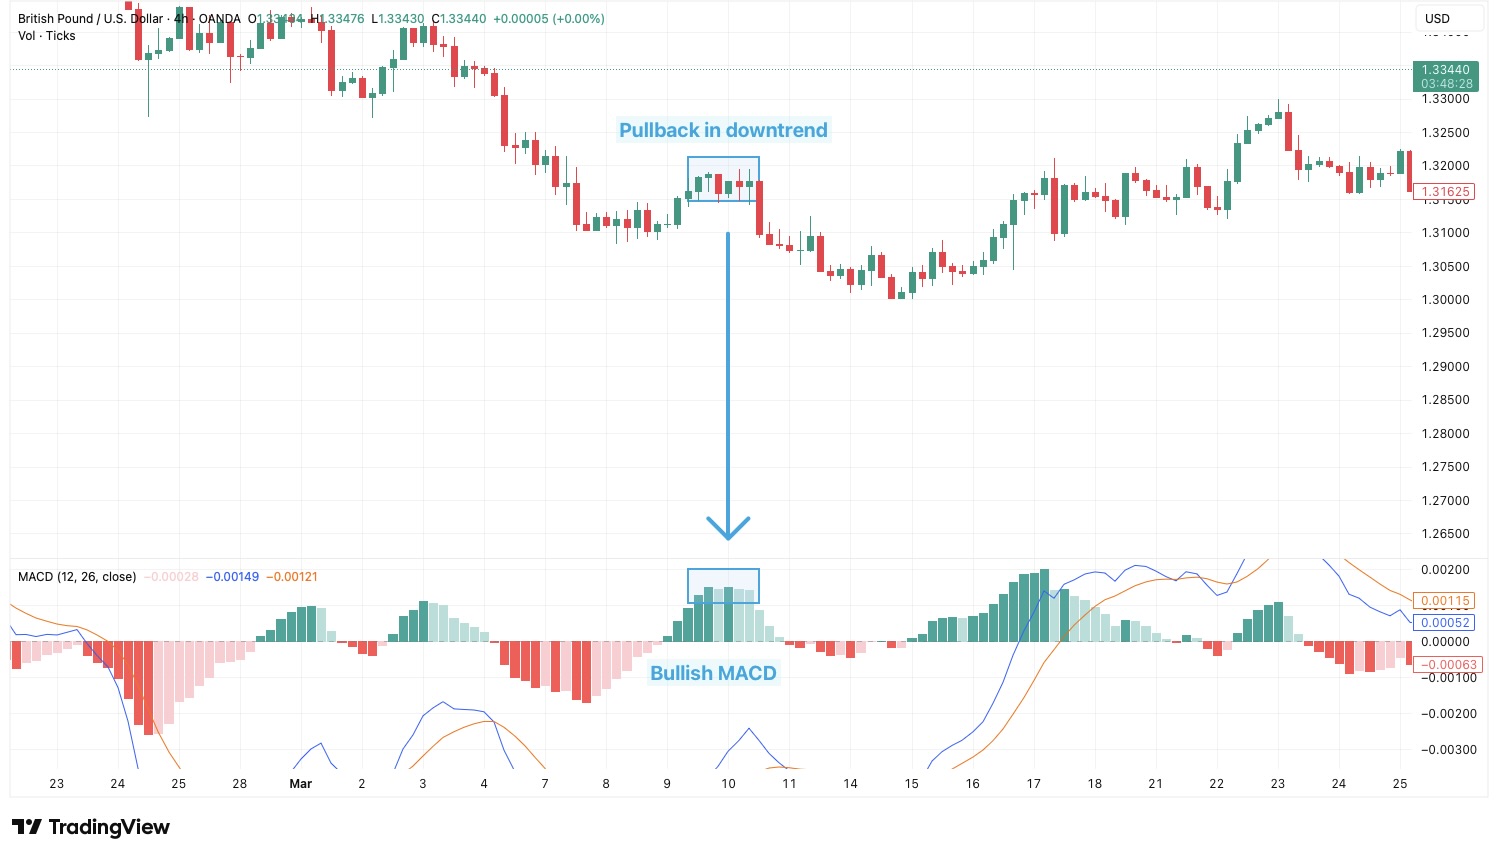
MACD histogram patterns can also highlight trend continuation (TC), especially when there is a brief interruption followed by a return to the previous trend.
 Source: TradingView. This example is for illustration purposes only and does not constitute financial advice. Past performance is not indicative of future results.
A common setup involves the histogram moving strongly in one direction, then pulling back briefly (showing reduced momentum), only to resume again in the original direction.
For example, if a market is trending upwards and the histogram is showing strong positive bars, a short dip followed by renewed growth in bar size may indicate that bullish momentum is still intact. The same applies in downward moves where bars below zero shrink, then expand again.
For example, if a market is trending upwards and the histogram is showing strong positive bars, a short dip followed by renewed growth in bar size may indicate that bullish momentum is still intact. The same applies in downward moves where bars below zero shrink, then expand again.
KEY IDEA 6
A short-lived interruption in histogram direction that is followed by renewed momentum can suggest a continuation of the prevailing trend.
In what market conditions is MACD typically used?
Because of the multitude of trading strategies (outlined above), the MACD is quite unique in its ability to be applied across different market environments. To put it another way, you need to choose the MACD strategy to suit the underlying market trend.
In trending markets, MACD turns into a trend-following indicator. To use this aspect of the indicator, you could focus on the position of the MACD line relative to the zero line or look for line crossovers in the direction of the prevailing move. Additionally, in these situations, strategies like continuation patterns and zero-line filters tend to be more relevant.
In range-bound or consolidating markets, you might shift focus toward MACD divergence or histogram reversals. These setups aim to spot potential turning points in momentum before price shows any sign of a reversal but is nearing the top/bottom of an already established range.
KEY IDEA 7
MACD can be used in different market phases, but the interpretation depends on whether the price is trending, consolidating, or shifting direction.
MACD in technical analysis
MACD is a staple in technical analysis, commonly used to assess both trend direction and momentum. It is considered a lagging technical indicator, meaning it reflects past price movements rather than forecasting future ones. MACD is often used alongside other classic technical analysis tools like support and resistance, volume, or RSI to provide additional context.
MACD vs Relative Strength Index (RSI): Overview and comparison
MACD and RSI are both widely used technical indicators, but they measure different aspects of price movement. Some traders use them together while others may choose just one depending on their approach.
Here is some of the key differentiators between MACD vs RSI:
Here is some of the key differentiators between MACD vs RSI:
- | MACD (Moving Average Convergence Divergence) | RSI (Relative Strength Index) |
What it measures | Momentum and trend direction using moving averages | Speed and change of recent price movements |
Type of indicator | Trend-following and momentum | Momentum oscillator |
Usually used in | Trending markets | Range-bound or overbought/oversold conditions |
Common signals | Line crossovers, histogram shifts, divergence | Crosses of overbought (70) or oversold (30) levels |
Key interpretation | Momentum building or fading based on moving average behaviour | Whether price may be stretched or due a pullback |
Sensitivity to market noise | Less sensitive due to smoothing via EMAs | More responsive to short-term swings |
Limitations | Can lag turning points, especially in sideways markets | Can stay overbought or oversold in strong trends |
To summarise, RSI focuses more on relative price extremes, while MACD looks at the relationship between two moving averages to gauge changes in momentum.
Pros & Cons of MACD
MACD has remained popular in technical analysis because it combines elements of trend following and momentum into a single indicator but its lagging nature and false signals put some traders off using it.
Pros of MACD
- Combines trend and momentum into one view
- Clearly shows potential shifts through line crossovers and histogram changes
- Customisable across timeframes, from short-term charts to longer-term analysis
- Easy to overlay on most charting platforms, with values calculated automatically
Cons of MACD
- It is a lagging indicator so by the time a signal forms, part (or even all) of the move may have already happened
- Less effective in sideways or choppy markets, where signals can be early & late
- Can produce false signals during low-volume periods or sudden spikes in price
This is a common reframe across technical indicators in general - while MACD can be a helpful part of technical analysis, it is not a complete system on its own so is best used alongside other technical tools and interpreted as part of a wider assessment of market conditions.
Recap
MACD (Moving Average Convergence Divergence) is a technical indicator that shows the relationship between two exponential moving averages. It is commonly used to assess momentum and trend direction through line crossovers, histogram changes, and its position relative to the zero line. While it can help highlight shifts in price strength, it is a lagging indicator and is best used alongside other tools for context.
FAQs
Q: How to avoid MACD false signals?
Some traders try to reduce false signals by confirming MACD setups with price structure, support and resistance levels, or additional indicators like RSI or volume.
Q: What is the formula for a MACD oscillator?
There are three formulas in one:
The MACD line is calculated as the 12-period EMA minus the 26-period EMA.
The MACD histogram is the MACD line minus the 9-period EMA (signal line).
Although MACD doesn't oscillate between fixed values like RSI, it is still considered a centerline oscillator because it fluctuates around the zero line.
Q: What does the MACD tell you?
It shows the strength and direction of momentum based on how two moving averages of price are behaving relative to each other.
Q: How do you use MACD for beginners?
Rookies often look at signal line crossovers, histogram changes, and the MACD’s position relative to the zero line to get a sense of price momentum.
Q: Is MACD bullish or bearish?
MACD is neutral by design so it can reflect either bullish or bearish conditions depending on the direction and alignment of its lines.
Q: What does 12, 26, 9 mean on MACD?
These are the default MACD settings: 12 for the fast EMA, 26 for the slow EMA, and 9 for the EMA of the MACD line (signal line).
Q: Why is MACD a popular indicator among traders?
MACD combines elements of both trend-following and momentum analysis in one tool, which makes it versatile across different trends and timeframes.
Q: Do professional traders use MACD?
Some professional traders include MACD in their chart analysis, often alongside other technical or fundamental indicators or methods for confirmation.
Q: How to use MACD to buy or sell?
The MACD doesn’t provide direct buy or sell signals, but it helps traders interpret momentum and trend changes.
When the MACD line crosses above the signal line, it may suggest bullish momentum, while a cross below can indicate bearish momentum.
Traders often use these signals alongside other indicators or support and resistance levels before deciding to buy or sell.
When the MACD line crosses above the signal line, it may suggest bullish momentum, while a cross below can indicate bearish momentum.
Traders often use these signals alongside other indicators or support and resistance levels before deciding to buy or sell.
Q: What are the 3 numbers in MACD?
The three numbers refer to the fast EMA (12), the slow EMA (26), and the signal line EMA (9), which shape the indicator’s behaviour.