Stocks volatility: Definition of the CBOE Volatility Index & VIX Index charts
Long-term investors often face periods of market turbulence, making it useful to understand volatility. One of the most widely followed measures is the Volatility Index (the VIX), created by the Chicago Board Options Exchange (CBOE), which reflects expected fluctuations in the S&P 500.
QUOTE
The true investor welcomes volatility… a wildly fluctuating market means that irrationally low prices will periodically be attached to solid businesses.
Big ideas
- The Volatility Index (VIX), developed by the Chicago Board Options Exchange (CBOE), captures the 30-day price sentiment of the S&P 500. It is often used as a broad indicator of perceived market risk.
- Volatility is the rate of change of prices, used as an indicator of market sentiment or fear/complacency. The CBOE Volatility Index is often referred to as the VIX or the fear index because it tends to rise during periods of heightened uncertainty or market stress.
- While VIX has its own ticker, it is purely an index. It can be traded through ETFs, futures, and options contracts. The VIX is measured on a percentage scale of 0 to 100, with a score above 30 being interpreted as very volatile. While VIX has its own ticker, it is purely an index. It can be traded through ETFs, futures, and options contracts. VIX is measured on a percentage scale of 0 to 100, with a score above 30 being interpreted as very volatile. Although the scale is commonly referenced as running from 0 to 100, the VIX is not technically capped at 100 and could exceed this level under extreme market conditions.
What is the CBOE Volatility Index (VIX)?
DEFINITION
The VIX is a measure of market sentiment that reflects the market’s expectations for 30-day forward-looking volatility in the S&P 500 index, based on the implied volatility of a wide range of S&P 500 index options.
The more that traders are willing to pay for options, the higher the expected volatility. If the prices of options go up, the VIX goes up.
There are two main measures of volatility:
There are two main measures of volatility:
- Implied = Expected Future Volatility (from options market)
- Historical = Actual Past Volatility (from price history)
The S&P 500 is an index of the largest 500 companies in the USA by market capitalisation. As such, the VIX is a very important metric, as the foremost volatility index of the biggest financial market in the world.
As a rule of thumb, the VIX usually:
As a rule of thumb, the VIX usually:
- Trades between 12 and 20 during stable periods.
- Values below 15 often mean the market may suggest lower expected volatility.
- When the VIX goes above 20, it can indicate rising market uncertainty or stress.
- Values above 30 are seen during strong sell-offs or periods of heightened uncertainty.
 Source: CBOE. Capital at risk. Past performance is no guarantee of future results.
How does the VIX Index work?
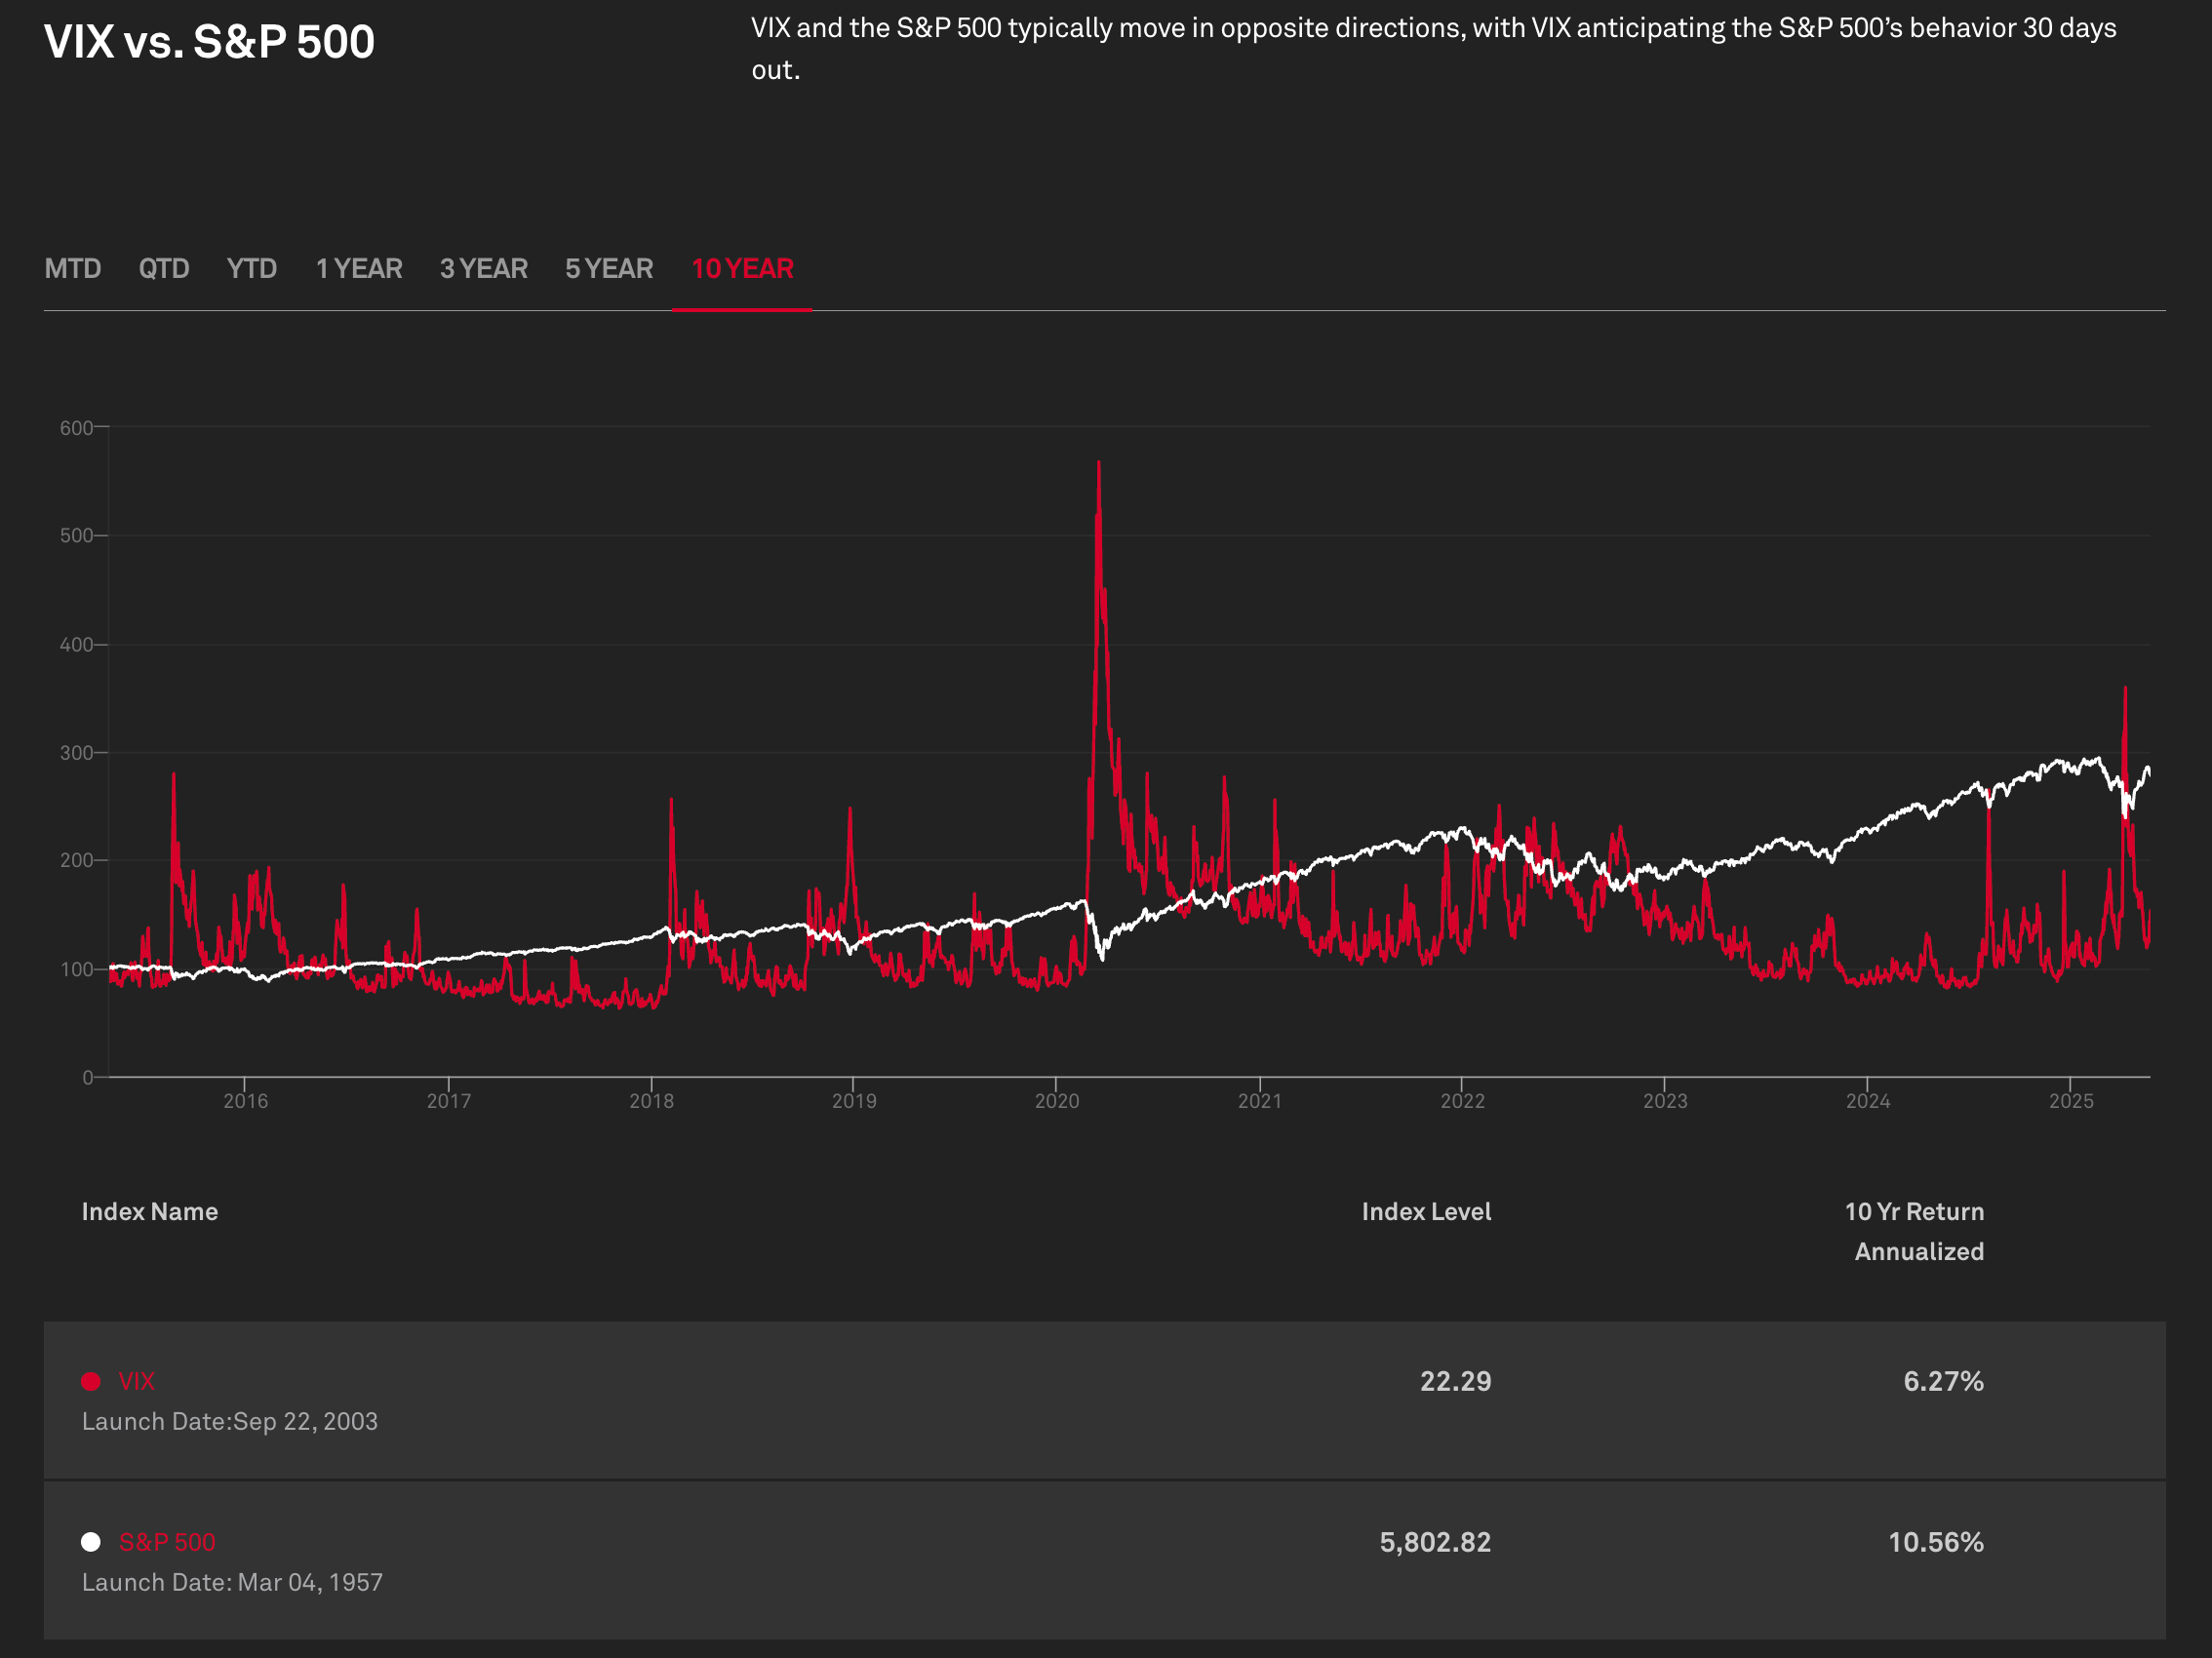
As mentioned, the VIX indicates how volatile the US stock market is, based on the S&P 500. When markets are rising (known as bull markets), investors tend to feel more confident, and trading usually stays relatively steady. But when markets fall (during bear markets), investors often get more cautious, which can lead to more movement and sharper swings in the market.
 Source: S&P Global. Capital at risk. Past performance is no guarantee of future results.
To calculate the VIX, the CBOE uses a range of S&P 500 index options. These include both call and put options with expiry dates between 23 and 37 days.
The following shows the relationship of the strike price of call and put options to its implied volatility.
The following shows the relationship of the strike price of call and put options to its implied volatility.

The formula for the VIX takes implied volatilities from many different strike prices. Each option contributes to the final value based on its price and how far it is from the current index. This approach aims to reflect how much the market expects the index to move.
The method gives more weight to options with prices that suggest higher expected movement. It also adjusts for the time left until the option expires. All this data goes into a formula that produces one number.
That number is then annualized and shown as a percentage. A higher VIX suggests greater expected price swings in the S&P 500, while a lower VIX indicates expectations of more stable market conditions.
The VIX Index calculation
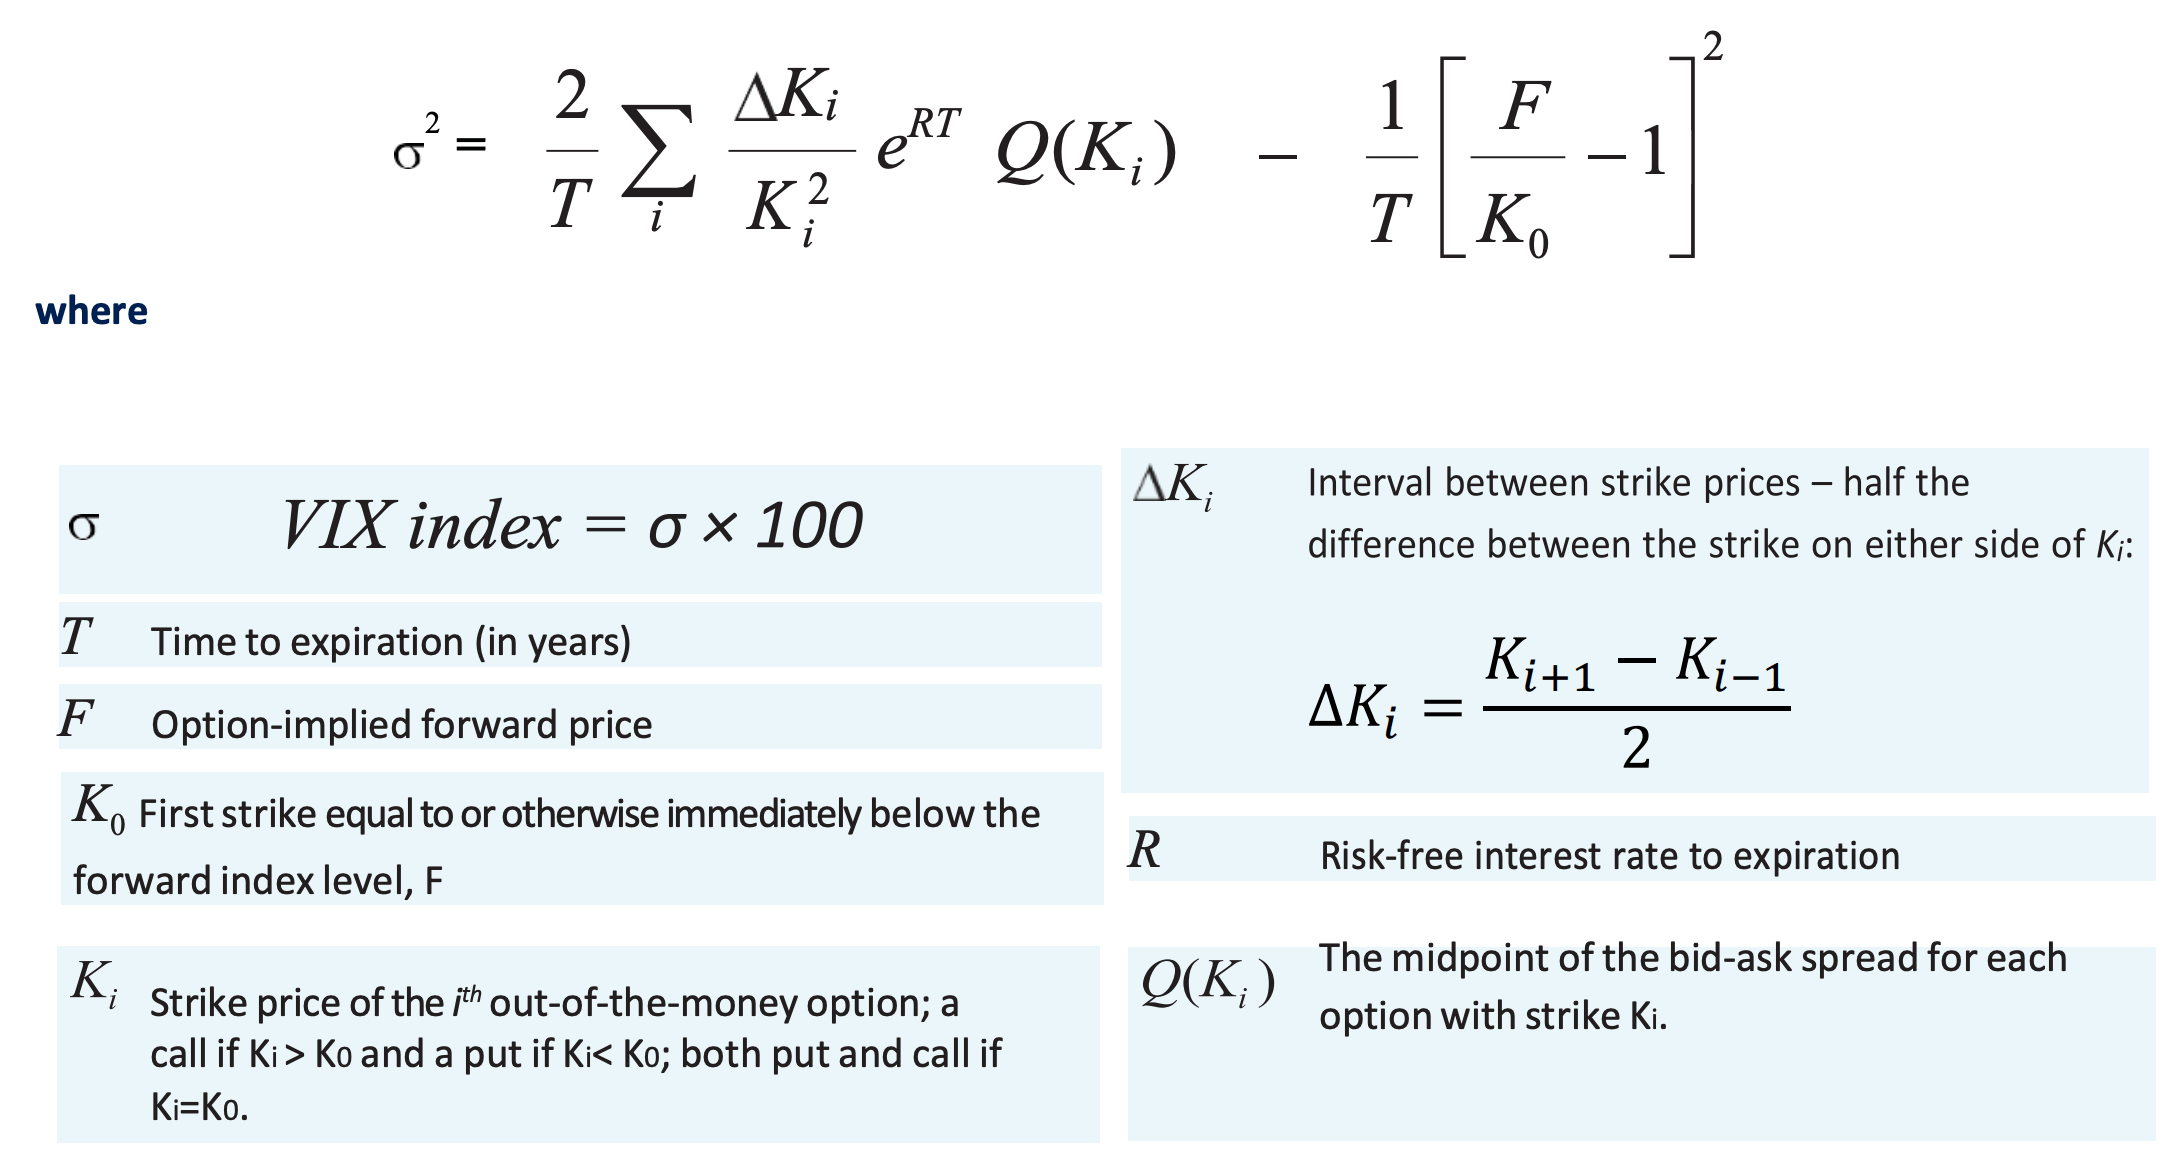 Source: Volatility Index®Methodology: Cboe Volatility Index®
The evolution of the VIX over time
The CBOE introduced the VIX in 1993. It was based on S&P 100 options at first. The goal was to create a clear measure of market expectations for short-term volatility. In 2003, the index was updated. It switched to S&P 500 options, which gave a broader picture of market sentiment. That version is still used today.
The VIX became popular because it gave traders a quick way to see what the market was pricing in, especially during stress. Over time, it turned into a common reference. News outlets picked it up, and analysts started using it in reports. People began calling it the fear index, and it became a go-to number for gauging uncertainty.
By the mid-2000s, the CBOE started offering futures and options on the VIX itself. That helped establish the VIX as a key indicator of market expectations, often referenced by investors and analysts to assess sentiment during times of uncertainty. It became part of the market. CBOE has also released many other indexes for different time periods.
How to trade the VIX: Futures, Options, and ETFs
The VIX itself is an index, not a stock or a traditional asset, so it can't be bought directly. But there are several ways to trade it:
- VIX futures – these are listed on the CBOE Futures Exchange. They allow traders to take positions on expected future VIX values. Contracts are available with different expiry dates.
- VIX options – these are options on VIX futures. They give traders a way to speculate on or hedge against future volatility levels. Like any option, they come with expiration dates and strike prices.
- ETFs and ETNs – some exchange-traded funds and notes aim to track VIX futures. Examples are VXX (iPath Series B S&P 500 VIX Short-Term Futures ETN), UVXY (ProShares Ultra VIX Short-Term Futures ETF), SVXY (ProShares Short VIX Short-Term Futures ETF). These don’t follow the VIX directly but try to copy changes in VIX futures.
Each method has its own approach. All of them are linked to futures, not the spot VIX number seen on most financial news sites. It is essential to thoroughly understand how they work, as well as the associated costs and risks, before considering any investment.
Using the VIX to understand market sentiment
Investors use the VIX to understand what the market expects in terms of risk and movement. It does not predict direction but shows the expected size of potential price moves. Some general ways the VIX is referenced include:
- Hedging – VIX-related products are sometimes monitored during periods of market uncertainty, as volatility levels often rise when stock prices decline and fall during market rallies.
- Timing trades – Some market participants pay attention to unusually high or low VIX readings. Elevated levels may reflect heightened uncertainty, while very low readings can indicate calmer conditions.
- Spread strategies – The VIX is also used in combination with S&P 500 options as part of broader strategies aimed at observing changes in volatility patterns.
- Mean reversion plays – The VIX has historically shown a tendency to return to its average levels over time, a behaviour that some market observers take into account when analysing volatility cycles.
The VIX is often used as a signal, not just as a product. It can support decisions in broader trading plans.
The evolution of volatility products
Volatility tools have expanded far beyond the VIX itself. New products aim to give more targeted ways to express views on risk. These include sector volatility indexes, new futures structures, and more refined tools for hedging or speculation tied to short or long-term market moves. There is also an equivalent for the bond market, known as the MOVE index.
VIX® index charts & data
VIX charts and historical data are often used in financial analysis. The data includes real-time levels, past close prices, daily highs and lows, and historical volatility ranges. It helps people understand how the index responds during different market events. Long-term data helps compare current values with previous baselines. However, past performance is not indicative of future results.
The role of the Fear Index (VIX) in financial analysis
The VIX is now built into many investment processes, including those that use strategies involving risk. It is closely watched by hedge fund managers, asset managers, and other investment professionals, as well as retail investors, seeking to understand broader market sentiment.
The VIX is widely used by financial professionals and is becoming increasingly accessible to a broader audience. Many platforms, including the Trading 212 app, offer access to VIX-related data and tools.
Retail investors often look to the VIX as one of several indicators that can provide additional context about market sentiment:
📈 A higher VIX may reflect heightened uncertainty
📉 A lower VIX can signal more stable conditions
Historically, extreme VIX levels have often aligned with market turning points – major troughs during panic spikes, or market tops when volatility is unusually low. However, the VIX is not a predictor of market direction or a guarantee of future outcomes.
Even if investors never trade volatility-related products, the VIX can still offer valuable insight. It reflects what the options market is pricing in and provides useful context for understanding broader market conditions.
Critical Perspectives of the VIX Index
While VIX is an important measure of volatility, it has received its fair share of criticism. It is also helpful to note that we are in a time of financial transformation where many assumptions are being questioned, with new models being introduced.
Research from the Lebanese-American essayist and mathematical statistician Nassim Taleb has indicated that the overall concept of volatility is grossly misunderstood. Other traders and researchers have indicated that the VIX has little predictive power, and that calculating VIX retrospectively would not have predicted events such as the 1929 Great Depression.
A potential issue with the VIX is that it tracks implied volatility as opposed to calculating actual volatility. VIX can move for reasons unrelated to actual risk. It is also a broad index, showing expected volatility for the whole market.
Recap
The VIX is a widely followed measure of expected market volatility over the next 30 days and is often referred to as a gauge of market sentiment or fear. While not a directional indicator, it provides useful context for understanding current market conditions.
However, the VIX is far from a perfect measure and is best viewed as a broad indicator or starting point for deeper analysis.
Interpreting its movements requires careful context and should take into account factors such as personal financial goals and risk tolerance.
This article is for informational and educational purposes only. It does not constitute investment advice. Do your own research.
FAQ
Q: What does the VIX tell us about market sentiment?
The VIX reflects the market’s expectations for how volatile the S&P 500 might be over the next 30 days. A high VIX suggests larger price swings are anticipated, often during periods of uncertainty or market stress. A low VIX typically signals expectations of more stable or less volatile conditions.
Q: What is the relationship between VIX and the S&P 500 price?
The VIX often moves in the opposite direction of the S&P 500. When the S&P 500 drops sharply, the VIX tends to rise, reflecting a jump in expected volatility based on options pricing. When markets are calm or steadily rising, the VIX usually falls. It is a measure of anticipated market swings, not investor sentiment or market direction.
Q: What is the most widely followed volatility index for stocks?
The VIX is commonly used as a volatility index for U.S. stocks. It tracks expected short-term moves in the S&P 500. Other indexes exist for different markets, but the VIX remains the standard for equity volatility.
Q: How do you read the VIX?
The VIX is a number that reflects expected volatility in percentage terms. A reading around 15 is often seen as low. Readings above 30 usually signal higher uncertainty or stress in the market. It does not predict direction, just the size of the movement.
Q: What is the FTSE Volatility Index?
The FTSE Volatility Index, also called the VFTSE or FTSE 100 Volatility Index, measures expected volatility in the UK’s FTSE 100 index over the next 30 days. It works like the VIX but is focused on the UK market.
Q: Can you invest in a volatility index?
Volatility indexes like the VIX can’t be invested in directly. However, there are financial products, such as futures, options, or exchange-traded notes (ETNs), that aim to track VIX futures. These instruments are complex and come with considerable risk, so they are typically suited to experienced traders.