FTSE 100 Index: Definition, top companies, performance and dividend yield for the Footsie
The FTSE 100 tracks the top 100 companies in the UK and is the most popular index for British investors. After underperforming US stock indices in recent years, it is experiencing all-time highs in 2024.
QUOTE
“The make-up of the FTSE 100 has changed dramatically in the past three decades. It is part of a constant cycle of healthy change for the stock market.”
Big ideas
- The FTSE 100 is a list of the top UK companies by market cap. The list is reviewed quarterly and often changes as stocks move up to the FTSE 100 and down to the FTSE 250.
- Due to globalization, the FTSE 100 is not an entirely accurate indicator of the performance of the UK economy. The FTSE 250 is superior in this regard because the companies listed there tend to make their revenue within UK borders.
- In the past 5 years, the FTSE has performed very poorly versus other major indexes. It is currently hitting all-time highs, breaching 8,400. But this is mainly due to the returns of a handful of international companies (such as Shell and AstraZeneca) and is not necessarily reflective of a stronger UK economy.
What is the Financial Times Stock Exchange?
DEFINITION
The Financial Times Stock Exchange (FTSE - pronounced “Footsie”) is like the UK equivalent of Standard & Poors. It offers a range of indexes to the global markets.
The entity that runs it is currently known as the FTSE Russell Group and is owned by the London Stock Exchange Group (LSEG). A merger took place between Russell Group and FTSE in 2015.
The entity that runs it is currently known as the FTSE Russell Group and is owned by the London Stock Exchange Group (LSEG). A merger took place between Russell Group and FTSE in 2015.
While it offers a range of indexes, the most popular are the FTSE 100 and the Russell 2000 Index. The FTSE 100 consists of top blue chip stocks listed on the London Stock Exchange (LSE) while the Russell 2000 consists of US small-cap stocks. Other indexes include:
- Russell Top 200
- Russell 1000
- Russell 2000
- Russell 3000
- Russell Geographic Exposure Indices
- FTSE 250
- FTSE 350
- FTSE All-Share
- FTSE Nasdaq 500
- FTSE AIM 100
- FTSE RAFI US 1000
A stock index, for those who don’t know, is merely a selected group of stocks based on a specific classification. This allows investors to diversify their holdings without having to do the research on each individual stock, which would take a lot of time and expertise to do correctly. An index already has these stocks, so index funds are a very useful investment mechanism.
FTSE 100 index definition, overview and significance in the UK market
DEFINITION
The FTSE 100 is the most popular index in the UK. It tracks the top 100 biggest companies by market capitalisation.
This is analogous to how the S&P 500 tracks the top 500 largest companies by market capitalisation in US markets.
This is analogous to how the S&P 500 tracks the top 500 largest companies by market capitalisation in US markets.
The FTSE 100 has a low-tech exposure and has been continually overshadowed by US indexes. It consists of older, low-growth companies. At the time of this writing, however, it is above 8,440 as a top-performing index. Critical analysts regard this as a bubble or overvaluation, as the index has a trend of rising but crashing shortly thereafter.
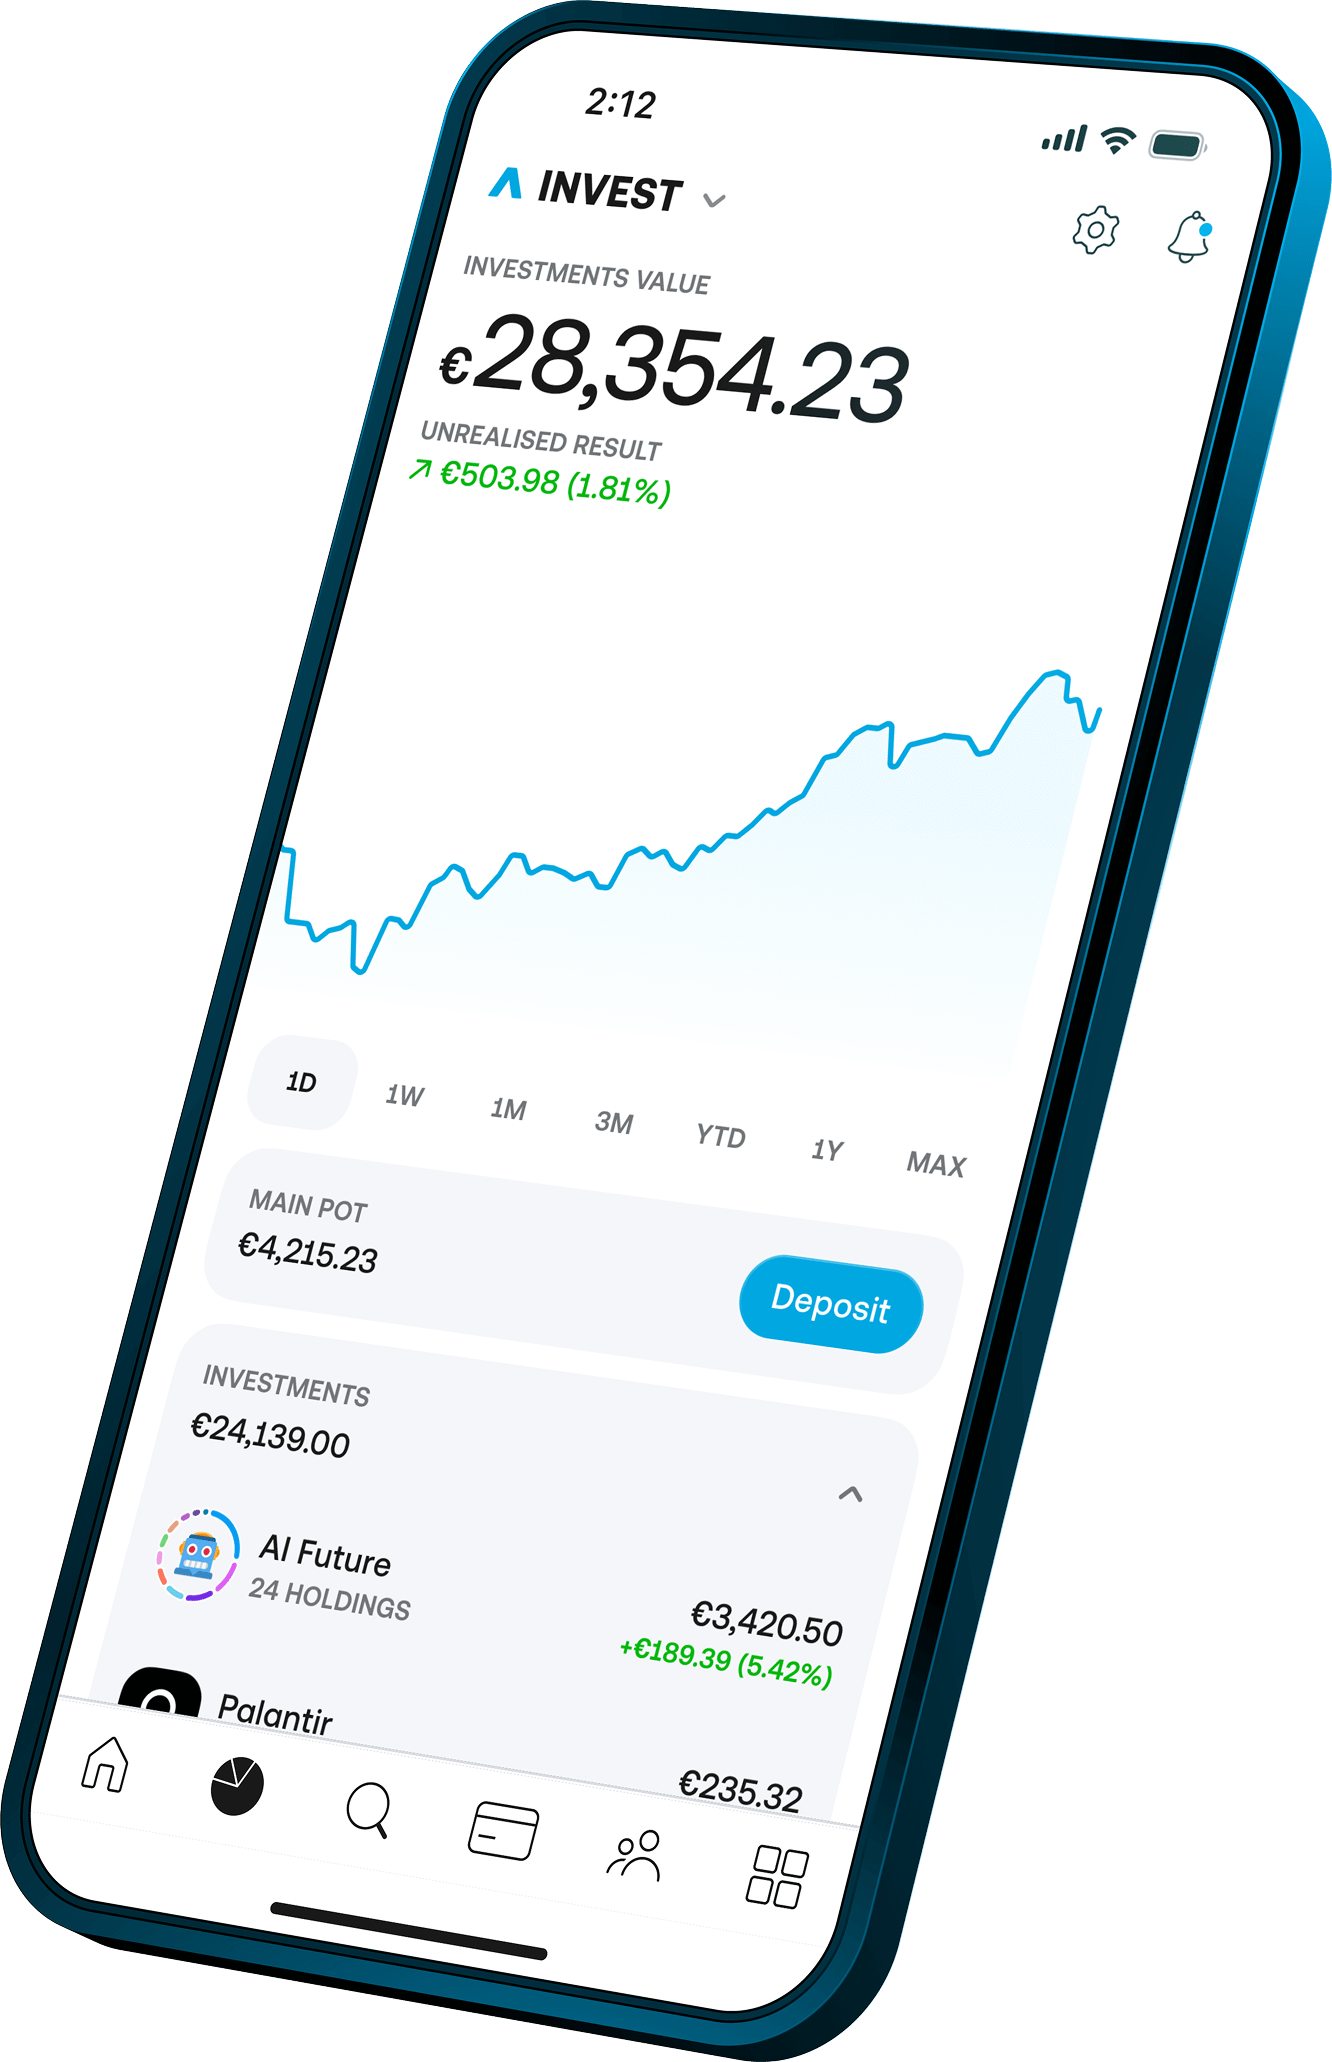
It is now easier than ever to buy the whole FTSE 100 index as an investment through the use of ETFs, all the most popular of which are available in the Trading 212 app. Simply use the search box and scroll to find your best FTSE 100 ETF.
It is now easier than ever to buy the whole FTSE 100 index as an investment through the use of ETFs, all the most popular of which are available in the Trading 212 app. Simply use the search box and scroll to find your best FTSE 100 ETF.
 Source: Trading 212 app. The information presented does not constitute investment advice and is intended to be of a general nature only. Please seek professional advice or do your own research before investing.
The performance of the S&P 500 is often used as a key indicator of the performance of the wider US economy. This is not quite the case with the FTSE 100, which has more of an international reach. In fact, UK investors can use it to access global markets more than they would use it to bet on their own country. This is because many of the companies listed are headquartered in the UK but do the bulk of their sales internationally.
Key characteristics and criteria for inclusion in FTSE 100
Companies aiming for FTSE 100 listing must report quarterly financial results and be listed on the London Stock Exchange, meeting minimum liquidity requirements. The FTSE Group also monitors listed companies' bonds to gauge their financial stability.
The FTSE 100 experiences change every three months to ensure it maintains the top 100 companies in the UK's main market. If there are takeovers or mergers before the scheduled changes, they're incorporated to keep the index up to date.
The council, consisting of independent experts, meets quarterly in March, June, September, and December to review and adjust the index based on the market capitalization of all companies on the London Stock Exchange. However, some meetings result in no changes, because the panel prefers to maintain stability where possible with minimal disruption.
DEFINITION
A company's market capitalisation is its total number of outstanding shares times its share price.
Market capitalisation, calculated by multiplying shares by the current price, determines listing. If a company in the FTSE 250 climbs into the top 90 of the FTSE 100, it gets added, and another is moved to the FTSE 250. If an FTSE 100 company falls below the 111th position, it's demoted to the FTSE 250.
Historical overview and evolution of the FTSE 100 index
The FTSE 100 was first formed in 1984, and a lot has changed since that date. Over 70% of the companies listed on the index at that time are no longer there. When it first launched, it was full of homegrown brands, some of which bore the name, such as British Aerospace and British Petroleum.
Other top brands included Tesco, Royal Bank of Scotland, Sainsburys, Lloyds Bank, Barclays, Boots, etc. Companies no longer included in the FTSE 100 since 1984 include Boots, Cadbury Schweppes, Ladbrokes, MFI, and more. Today, the FTSE 100 is full of international brands like GlaxoSmithKline, HSBC, and Royal Dutch Shell.
These international companies generate sales overseas, which is a significant point. While they might be domiciled in the UK, revenue is generated abroad. This is why the FTSE 250 is often regarded as a better indicator of UK performance, as more of the companies within that index generate revenue within the region.
Along with the individual stocks, sector weightings have also changed. Healthcare and consumer staples have made up larger weightings in recent years. Clearly, technology stocks have also made a huge impact. Finance and energy stocks still make up large weightings, but less than has historically been the case.
FTSE 100 companies and top performers
The FTSE 100 is composed of a diverse range of companies spanning various sectors, reflecting the breadth of the UK economy. Prominent stocks within the index include multinational giants like BP, Royal Dutch Shell, and HSBC, which operate across multiple industries and have significant global presence. These companies often serve as leading indicators for the overall market sentiment due to their substantial market capitalization and widespread influence.
ICB Supersector wieghting of FTSE 100
 Source: Money Unshackled
Sector representation in the FTSE 100 is well-balanced, with significant contributions from industries such as finance, healthcare, consumer goods, and energy. Financial institutions like Barclays and Lloyds Banking Group play a vital role in the index, reflecting the importance of the UK's financial services sector. Similarly, pharmaceutical companies like AstraZeneca and GlaxoSmithKline contribute significantly, highlighting the country's strength in healthcare and life sciences.
Other sectors represented in the FTSE 100 include telecommunications, technology, and retail, with companies like BT Group, Vodafone, and Tesco holding prominent positions. This diverse composition ensures that the index remains resilient to sector-specific challenges - and might be considered an interesting alternative to those seeking a hedge against another dotcom-style tech bubble.
Other sectors represented in the FTSE 100 include telecommunications, technology, and retail, with companies like BT Group, Vodafone, and Tesco holding prominent positions. This diverse composition ensures that the index remains resilient to sector-specific challenges - and might be considered an interesting alternative to those seeking a hedge against another dotcom-style tech bubble.
FTSE 100 performance and returns
Since its inception in 1984, the FTSE 100 has been a cornerstone of the UK stock market, comprising the top 100 companies listed on the London Stock Exchange. Over the decades, its performance has been closely monitored and it has undergone many significant changes in its makeup.
FTSE 100 5-year weekly chart
 Source: TradingView. Capital at risk. Past performance doesn’t guarantee future results.
Analyzing the long-term and short-term performance of the FTSE 100
The FTSE 100's long-term performance showcases a consistent upward trend, punctuated by periodic downturns driven by economic recessions, global crises, or industry-specific challenges. In contrast, the short-term performance of the FTSE 100 is characterized by volatility, influenced by immediate factors such as quarterly earnings reports, geopolitical tensions, or unexpected regulatory changes.
During the dot-com bubble burst in the early 2000s, technology companies like Marconi faced significant losses, dragging down the index temporarily. However, companies like BP and GlaxoSmithKline, with diverse revenue streams, demonstrated resilience, contributing to the index's recovery.
When the UK voted to leave the European Union in 2016 (ie Brexit), companies like Barclays and Royal Bank of Scotland experienced sharp declines in their stock prices, reflecting investor uncertainty about the future economic landscape. Some companies such as HSBC considered delisting from the FTSE 100 but ultimately decided against it. But companies with strong international presence, like Unilever and Diageo, weathered the storm better, benefiting from currency fluctuations and global demand for their products.
Understanding the average return and factors influencing performance
The average return of the FTSE 100 over the years has been relatively steady, outperforming traditional savings accounts and bonds. However, the exact average return can vary depending on the time frame analyzed.
For instance, between 2010 and 2020, the average annual return of the index was approximately 7%, buoyed by strong performances from companies like Burberry and AstraZeneca, which capitalized on emerging market opportunities and innovation in pharmaceuticals.
Several factors influence the performance of the FTSE 100, including macroeconomic indicators, industry trends, and company-specific factors. Economic factors such as GDP growth, inflation rates, and interest rates can impact investor sentiment and market dynamics, affecting the overall performance.
FTSE 100 sector rotation and diversification
Understanding sector rotation is key to diversification and a sound investment strategy. If you are well diversified across sectors, then your portfolio is much more robust - money is always going to be spent on something, even during times of economic collapse and global uncertainty.
The following table outlines the sector composition of the FTSE 100 from 2018 to 2024:
The following table outlines the sector composition of the FTSE 100 from 2018 to 2024:
Sector | 31/12/2023 | 31/12/2022 | 31/12/2021 | 31/12/2020 | 31/12/2019 | 31/12/2018 |
Communications | 2.79% | 3.27% | 4.31% | 4.54% | 5.37% | 5.81% |
Consumer discretionary | 7.17% | 6.12% | 6.87% | 8.32% | 6.72% | 6.26% |
Consumer staples | 17.09% | 19.38% | 17.91% | 19.67% | 15.77% | 15.84% |
Energy | 12.82% | 13.02% | 9.48% | 8.76% | 14.39% | 17.23% |
Financials | 19.07% | 17.67% | 17.82% | 18.44% | 20.25% | 20.46% |
Health care | 12.19% | 12.32% | 11.73% | 10.47% | 10.98% | 9.69% |
Industrials | 13.18% | 10.04% | 12.16% | 10.39% | 10.05% | 9.10% |
Information technology | 1.07% | 0.98% | 1.41% | 1.29% | 1.01% | 1.03% |
Materials | 9.47% | 12.29% | 13.39% | 13.35% | 10.83% | 10.40% |
Real estate | 1.02% | 1.06% | 1.38% | 1.20% | 1.20% | 0.99% |
Utilities | 4.18% | 3.85% | 3.53% | 3.58% | 3.45% | 3.18% |
Source: Siblis Research
While most industries have remained stable, communications have been decimated with a 50% decline in representation. Energy stocks have also taken a hit, from 17.2% to 12.8%. In contrast, Healthcare and industrials have both observed significant increases from 2018 to 2024 in the index.
While most industries have remained stable, communications have been decimated with a 50% decline in representation. Energy stocks have also taken a hit, from 17.2% to 12.8%. In contrast, Healthcare and industrials have both observed significant increases from 2018 to 2024 in the index.
Dividend yield and ex-dividend dates in FTSE 100
The dividend yield is a critical metric for investors in the FTSE 100, indicating the annual dividend income relative to the stock price. It's calculated by dividing the annual dividend per share by the stock price, expressed as a percentage.
A higher dividend yield suggests that a company distributes a larger portion of its profits to shareholders, making it an attractive investment for income-oriented investors.
A higher dividend yield suggests that a company distributes a larger portion of its profits to shareholders, making it an attractive investment for income-oriented investors.
FORMULA
Dividend Yield = Annual Dividends Paid Per Share / Price Per Share
Ex-dividend dates are equally crucial as they determine eligibility for receiving upcoming dividend payments. Investors must purchase shares before the ex-dividend date to qualify for the dividend. If shares are bought on or after this date, the buyer is not entitled to the dividend for that particular period. Savvy investors often monitor ex-dividend dates to optimize their dividend income and make informed investment decisions in the FTSE 100.
FTSE 100 P/E ratio and valuation metrics
The P/E ratio, or price-to-earnings ratio, is a vital metric within the FTSE 100, indicating investors' willingness to pay for a company's earnings. Vodafone, a key player in the index, may have a P/E ratio of 15, suggesting investors are valuing it at 15 times its earnings per share.
A higher P/E ratio often reflects optimism about future growth, while a lower ratio may indicate potential undervaluation. Understanding P/E ratios helps investors gauge relative valuation and identify potential investment opportunities within the FTSE 100.
A higher P/E ratio often reflects optimism about future growth, while a lower ratio may indicate potential undervaluation. Understanding P/E ratios helps investors gauge relative valuation and identify potential investment opportunities within the FTSE 100.
FORMULA
P/E Ratio = Earnings per share/Market value per share
The P/E ratio, a key metric in the FTSE 100, varies over time and in comparison to other indices. Historical averages provide context for current valuations. For example, if the FTSE 100's current P/E ratio is higher than its historical average, it might indicate overvaluation, suggesting caution to investors.
Conversely, a lower ratio could signal undervaluation, potentially presenting investment opportunities. Comparing the FTSE 100's P/E ratio to other indices, such as the S&P 500 or the Nikkei 225, offers insights into global market trends and relative valuation. However, it's essential to consider regional economic conditions and sector compositions when making comparisons.
Conversely, a lower ratio could signal undervaluation, potentially presenting investment opportunities. Comparing the FTSE 100's P/E ratio to other indices, such as the S&P 500 or the Nikkei 225, offers insights into global market trends and relative valuation. However, it's essential to consider regional economic conditions and sector compositions when making comparisons.
FTSE 100 performance vs other indexes
The FTSE 100 can be compared to other indexes on a yearly basis to gauge its returns. This can help to decide which index to invest in. Not all are equal, and they represent their underlying economies to varying degrees. The following table showcases how the FTSE performed up until late 2023.
Index | 1-year | 5-years |
FTSE 100 | 1.46% | 0.5% |
S&P 500 | 12.83% | 55.01% |
Nikkei 225 | 15.1% | 41.41% |
CSI 300 | -7.12% | 13.62% |
DAX | 22.33% | 28.23% |
CAC 40 | 18.17% | 35.73% |
Source: Select Wealth. Past performance doesn’t guarantee future results.
This indicates the importance of diversification, even among indexes. The table is current as of August 2023. While the FTSE 100 is currently doing very well, many are saying that it is soon set to crash back down - and it has a history of doing so.
A handful of companies such as AstraZeneca (up 61%) and Shell (up 29%) are attributed with bumping up the index, as opposed to a more robust UK economy. And the FTSE 250 is not doing anything interesting in terms of its price. Finally, a weaker pound correlates to a stronger FTSE 100. Most companies in the FTSE 100 earn in dollars and report in pounds.
Recap
The FTSE 100 is the most popular UK index. However, the FTSE 100 consists of many multinational companies that generate their revenue offshore. It has been subject to much change, and the FTSE 250 is arguably a better representation of the UK economy.
You’ll find more UK companies there if you think that the UK is on the way up. But despite current highs, the FTSE 100 is actually among the poorest performers compared to other popular indexes such as the DAX 40, Nikkei 225, and S&P 500. It might be worth checking out the FTSE SmallCap and FTSE Fledgling, as well as the FTSE 250 and FTSE 350, if you still want to focus on the UK market.
It’s never wise to over-commit to an index unless it specifically matches your trading preferences and risk tolerance - which is what many investors did with the FTSE 100 in the past, believing it was an investment in the UK economy.
While some contend that we might be setting a precedent for new highs in the FTSE 100, the reality is that the median company rise since 2019 is only 5% as opposed to the index rise of 10% - it’s floating on the gains of companies such as Shell and AstraZeneca.
FAQ
Q: Who regulates the FTSE 100?
The FTSE 100 is regulated by the Financial Conduct Authority (FCA) in the UK. The FCA ensures that the index adheres to regulatory standards and maintains transparency in its operations, protecting investors' interests and fostering confidence in the financial markets. While it is regulated by the FCA, the index is maintained by the Financial Times Stock Exchange.
Q: How do macroeconomic and political events affect the FTSE 100?
Macroeconomic and political events can significantly impact the FTSE 100. For example, changes in interest rates, inflation rates, or GDP growth can influence investor sentiment and market dynamics, leading to fluctuations in the index.
Similarly, geopolitical tensions, elections, or trade agreements can create uncertainty. Shocks like COVID-19 can play a huge role, increasing the prominence of health stocks and consumer staples.
Similarly, geopolitical tensions, elections, or trade agreements can create uncertainty. Shocks like COVID-19 can play a huge role, increasing the prominence of health stocks and consumer staples.
Q: What are sustainability factors and how do they affect the FTSE 100?
Sustainability factors, such as environmental, social, and governance (ESG) criteria, increasingly influence the FTSE 100. Companies committed to sustainable practices may attract investors seeking responsible investments, potentially leading to higher stock prices and improved market performance. Conversely, companies with poor ESG performance may face reputational risks and investor scrutiny, impacting their stock prices and overall contribution to the index.
Q: What role do futures and options play in the FTSE 100?
Futures and options play a crucial role in the FTSE 100 by providing investors with tools to hedge against market risks and speculate on future price movements. Futures contracts allow investors to buy or sell the index at a predetermined price on a specified future date, while options provide the right, but not the obligation, to buy or sell the index at a predetermined price within a specific timeframe. These derivative instruments enhance market liquidity and enable investors to manage portfolio exposure efficiently.
Q: What role does risk management and hedging play in the FTSE 100?
Risk management and hedging are essential aspects of the FTSE 100, allowing investors to mitigate potential losses and protect their portfolios against adverse market movements. Strategies such as diversification, asset allocation, and the use of derivatives like futures and options help investors manage risk exposure and preserve capital in volatile market conditions.
Q: What is the relationship between ETFs and the FTSE 100?
Exchange-traded funds (ETFs) are financial instruments that track the performance of the FTSE 100 index, offering investors exposure to a diversified portfolio of stocks within the index. ETFs provide an efficient and cost-effective way for investors to invest in the FTSE 100, offering liquidity, transparency, and flexibility in trading.
By investing in ETFs, investors can gain exposure to the broader market without having to buy individual stocks, making them a popular choice for both retail and institutional investors seeking broad market exposure with minimal effort.
By investing in ETFs, investors can gain exposure to the broader market without having to buy individual stocks, making them a popular choice for both retail and institutional investors seeking broad market exposure with minimal effort.